
Around 1.6 million spectra were produced by the time LAMOST publish the 2nd data release. It is said that 97% of stars in the Milky Way will eventually evolve into white dwarfs (WD; Fontaine, Brassard & Bergeron 2001). WDs can provide an accurate record of the star formation, evolution history of the Milky Way (Harris et al. 2006). They are also the important tools of studies on the ages of Galactic populations by constraining their luminosity and mass functions (Kepler et al. 2007). Furthermore, by considering an initial-final mass relation of stars that end their lives as WDs, important studies on mass-loss and stellar evolution can be conducted, thus providing crucial information for the chemical evolution of the Galaxy (Catalan et al. 2008).
This research adopted three independent methods to select the WD candidates from LAMOST spectra. Those are color-color cut, LAMOST pipeline and the width of Balmer lines. Then we visually inspected ~30k candidate spectra obtained from these methods, and found there are 1056 DAWDs, 34 DBWDs, 276 main-sequence WD binaries and other 12 types of WDs. After cross match with other catalogs, 383 DAWDs, 4 DBWDS and 138 MSWDs are new identifications.
We picked DAWDs whose signal to noise ratio (S/N) are greater than 10 to fit with model. First, we used WD atmosphere model (Koester 2010) to fit the Balmer absorption lines, this yielded effective temperature and surface gravity. Then by applying WD cooling model (Bergeron, Leggett & Ruiz 2001), we obtained mass and cooling age.
In this study, we also chose MSWDs with high S/N to fit their spectra. According to spectral decomposition and fitting method from Li et al. (2014), we obtained effective temperature, surface gravity, mass, cooling age, radius and distance for the WD; and effective temperature, surface gravity, mass, radius, metallicity and subtype for the M type companion star.
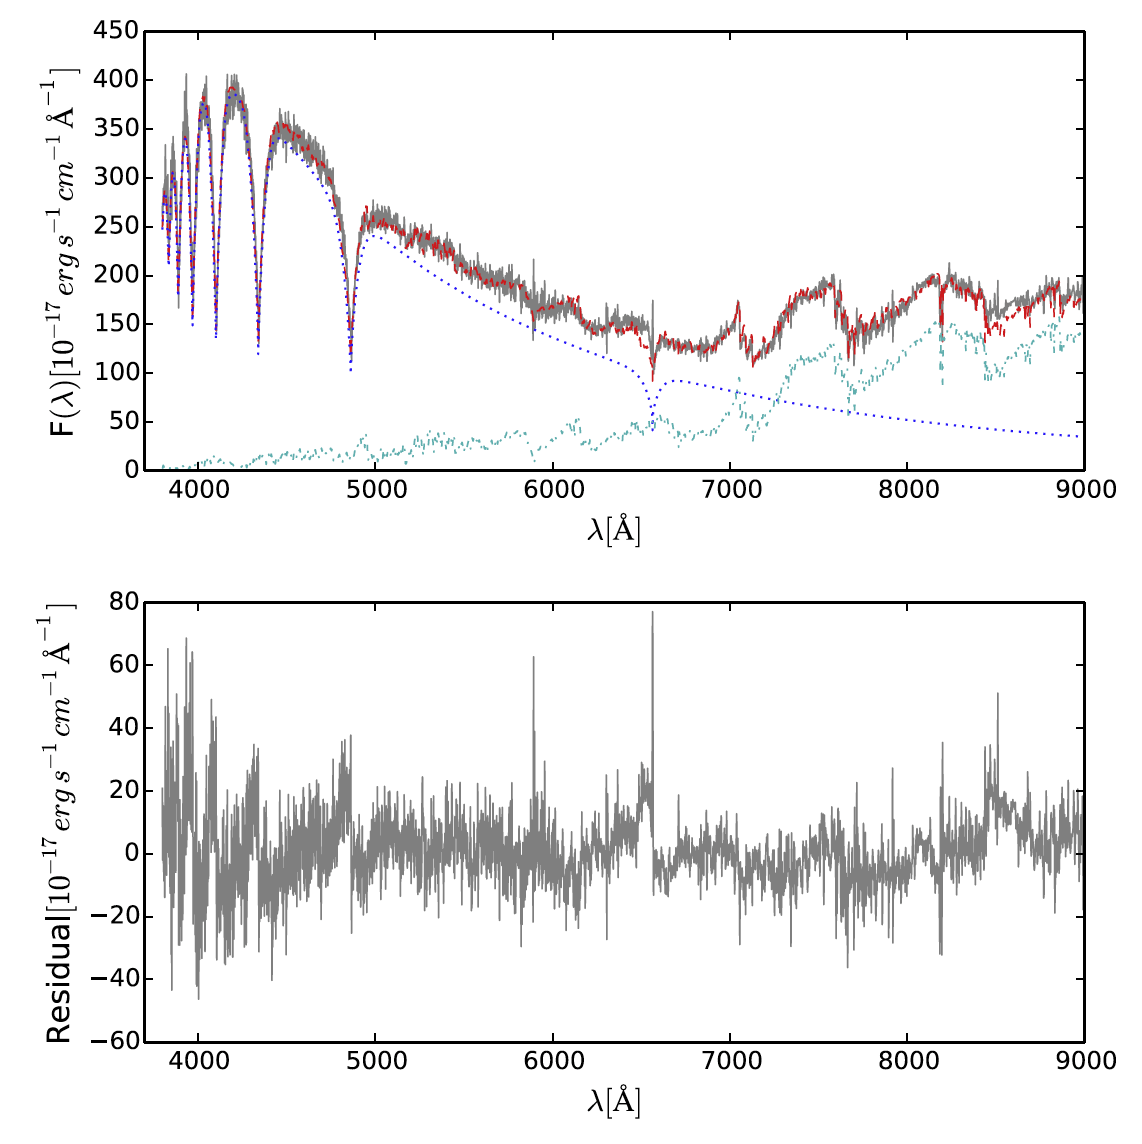
Figure 1. WD and M star templates fit to the LAMOST spectrum spec-56246-GAC121N33B1_sp03-027. Top panel: the grey solid line is the LAMOST spectrum, while dashed red line is the combination of best-fitted WD and M-star model. Blue dotted line is the WD model and cyan dashed line is the M-star model. The residual of best fit is shown in the bottom panel.
The distribution of those fitted parameters are normal and consistent with other research. The parameters estimated from other catalogs seems to be in agreement with ours, except differences indeed exist in those spectra with low S/N. In addition, through our analysis, we found that the low ratio of WD identified in LAMOST compare to SDSS, maybe caused by biased source selection and relatively brighter targets.