Release Note for LAMOST DR7_v2
- 1.Statistical Analyses of Parameters for Low-Resolution Part
- (1). Distributions of Atmospherical Parameters (Teff, logg, [Fe/H], [α/M]), Radial Velocity (rv) and the errors
- (2). The Parameter Comparisons between DR7_v2 Low-resolution Part and SDSS
- (3). The Parameter Comparisons between DR7_v2 Low-resolution Part and APOGEE
- 2.Statistical Analyses of Parameters for Medium-Resolution Part
- (1). Distributions of Error of Atmospherical Parameters (Teff, logg, [Fe/H], [α/M]), and Radial Velocity (rv) estimated by LASP for the combined spectra
- (2). The Comparisons of Parameter between DR7_v2 Medium-resolution Part and APOGEE
- (3). The Comparisons of Parameter between DR7_v2 Medium-resolution Part and GALAH
- (4). Distributions of Atmospherical Parameters (Teff, logg, [M/H], and [α/M]) estimated by CNN
- LAMOST DR7_v2 is released to all the users in September of 2021. It consistes of two components: the low-resolution part and the medium-resolution part. We make analyses of the parameters for low-resolution and medium-resolution data respectively, which are described in detail as follows.
- 1.Statistical Analyses of Parameters for Low-Resolution Part
(1). Distributions of Atmospherical Parameters (Teff, logg, [Fe/H], [α/M]), Radial Velocity (rv) and the errors
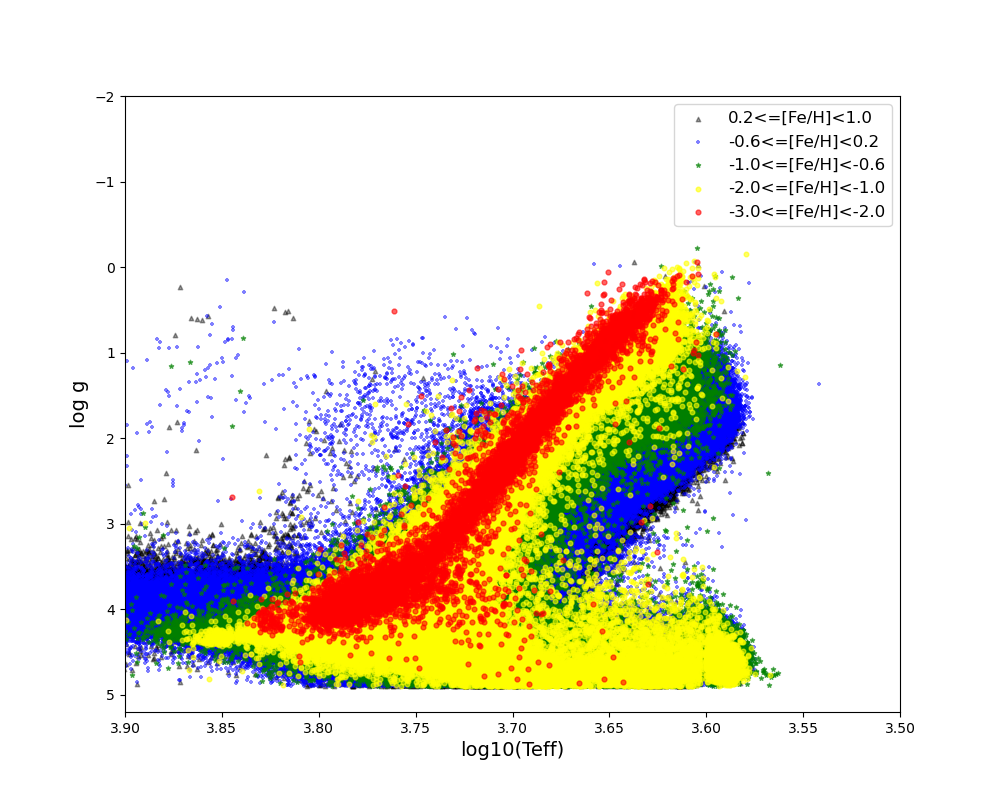
- The atmospherical parameter distribution of DR7_v2 is shown as follows. Metallicity bins are represented by different colors.
The following diagrams show the distributions of errors of atmospherical parameters (Teff, logg, [Fe/H], [α/M]) as well as rv in different SNR of r band (snr)) bins. These parameters are estimated by LASP.
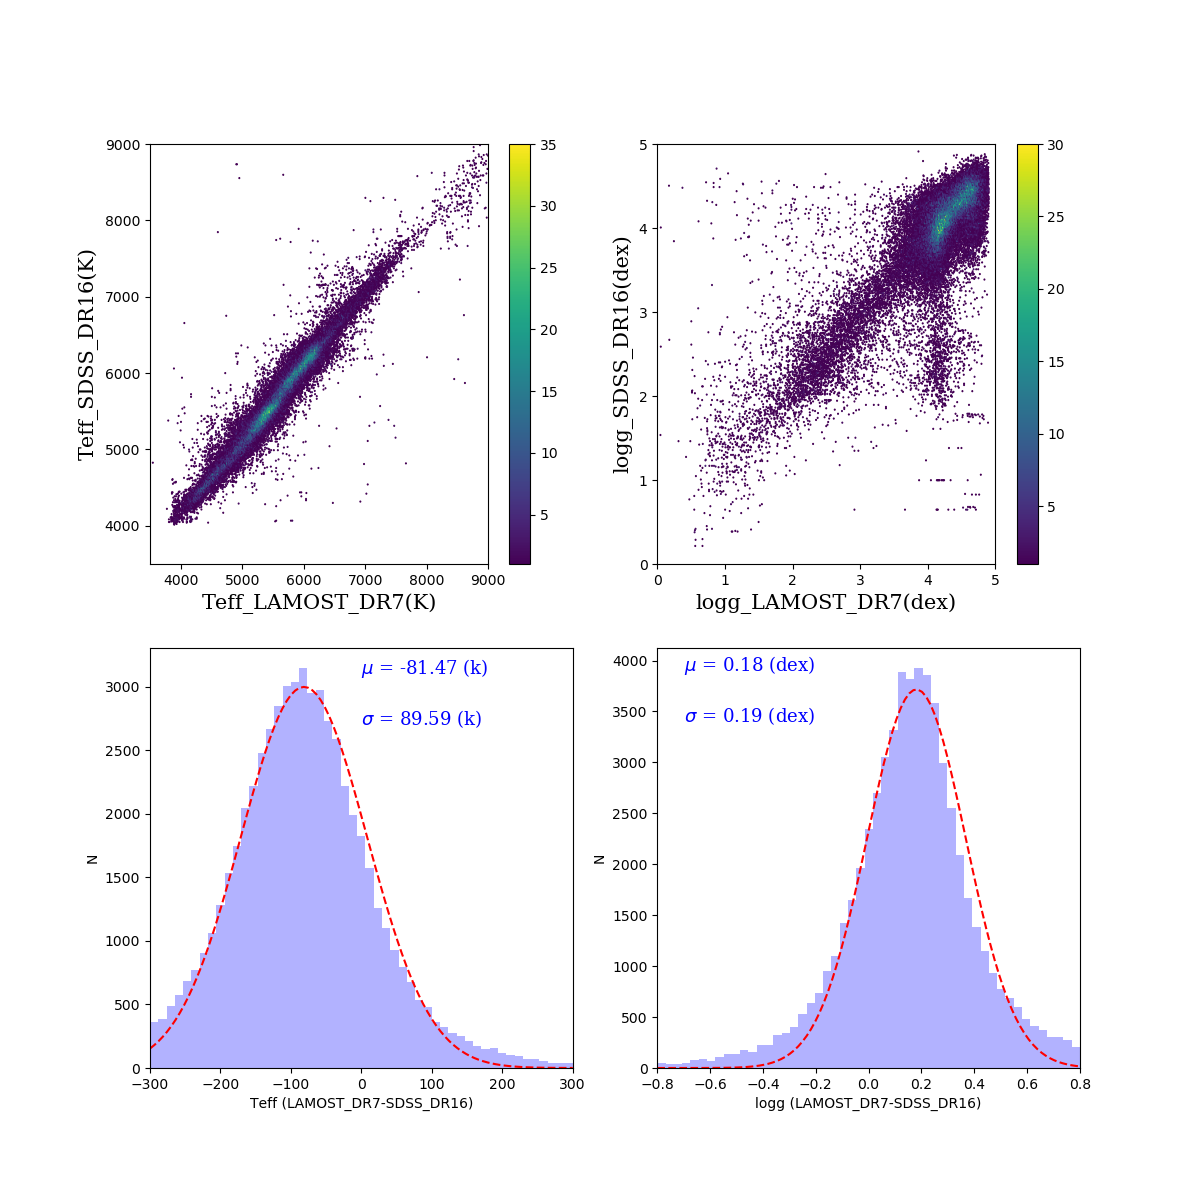
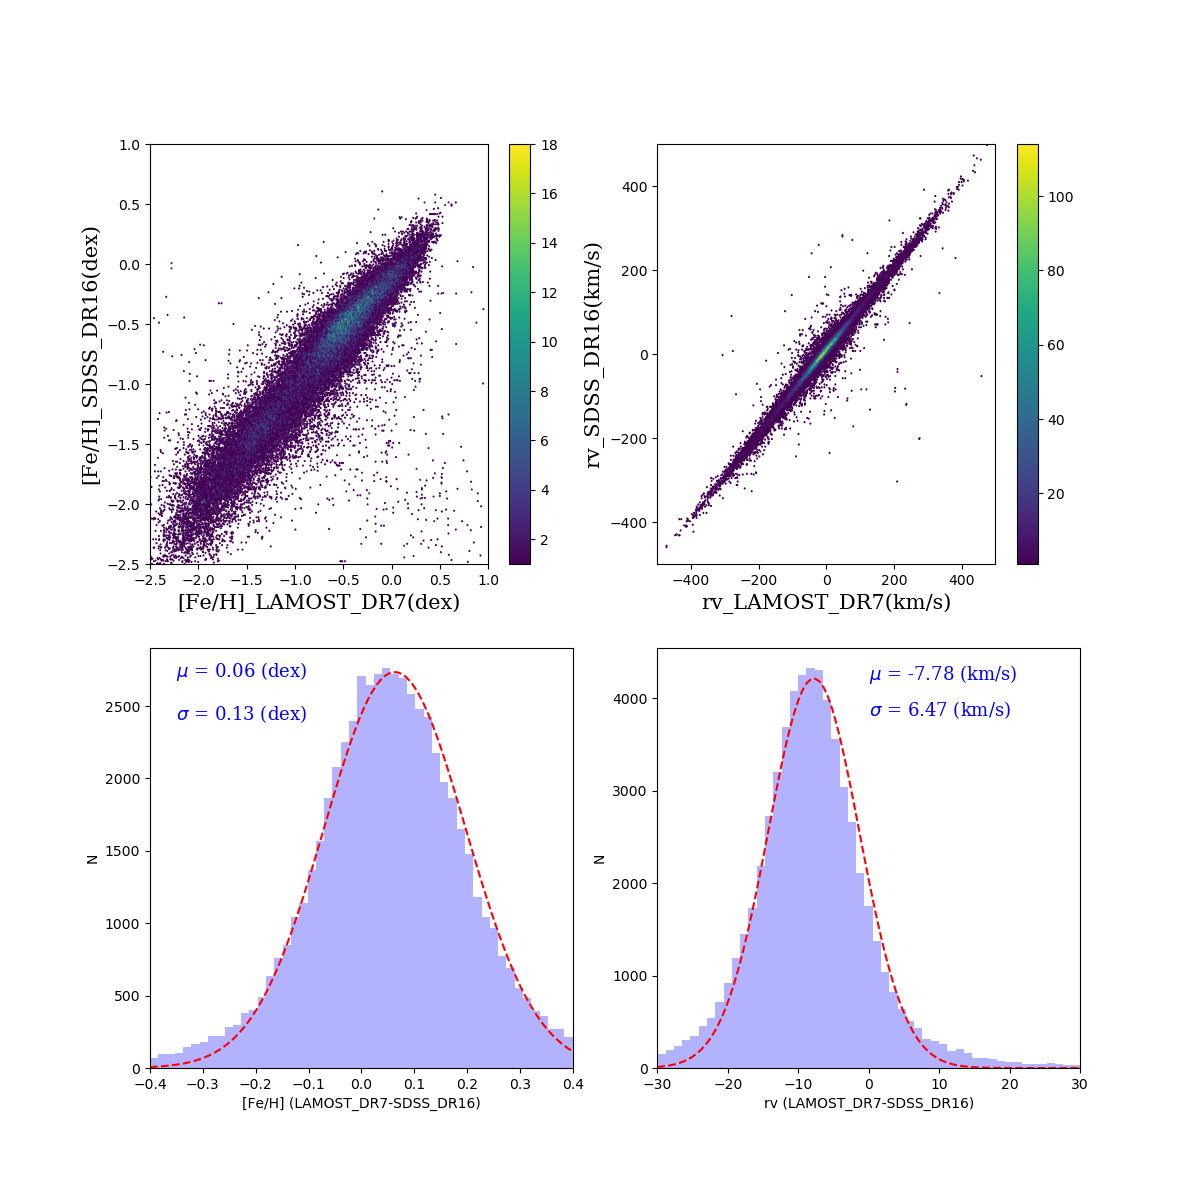
(2). The Parameter Comparisons between DR7_v2 Low-resolution Part and SDSS
- The following figures show the comparisons of atmospherical parameters (Teff, logg, [Fe/H]) as well as rv between DR7_v2 low-resolution data and SDSS DR16. The mean values and the standard deviations of the differences are also plotted in the figures. For the parameters of logg, a branch is seen in the top-right panel. It could be explained by the inhomogeneous distribution of the atmospherical parameters in the ELODIE library. There are holes for giants in the ELODIE library, making the estimations of the initial guess for atmospherical parameters in the giant holes inaccurate.
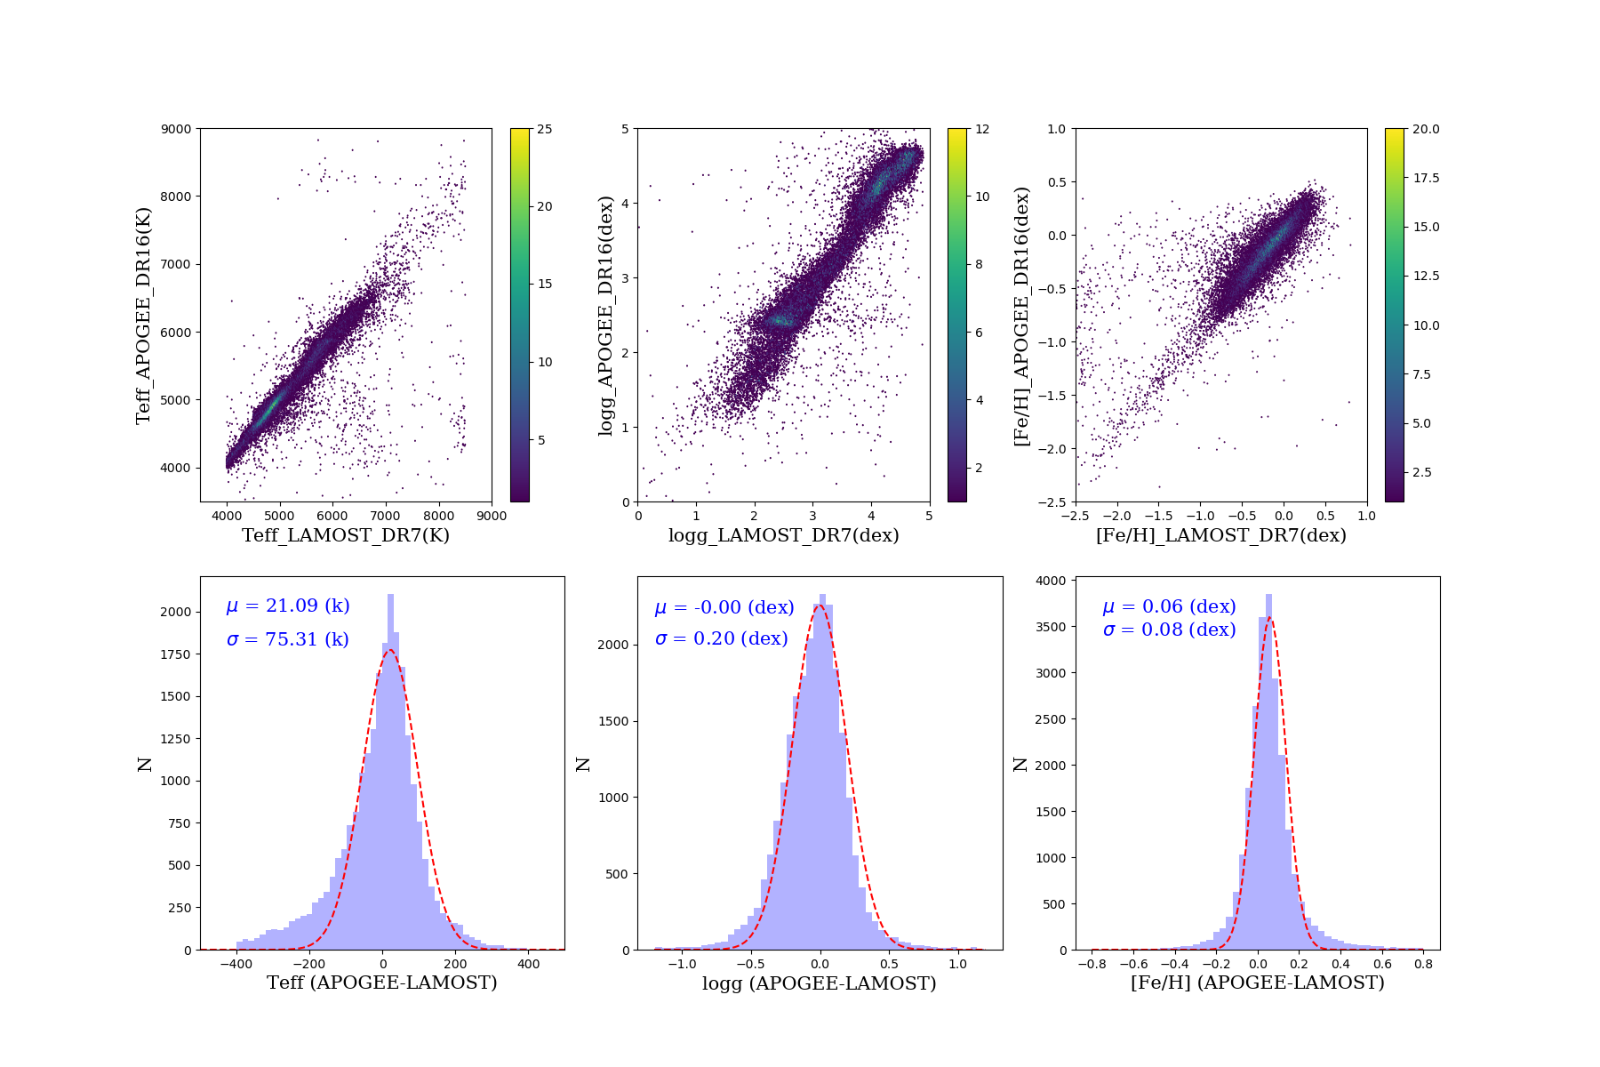
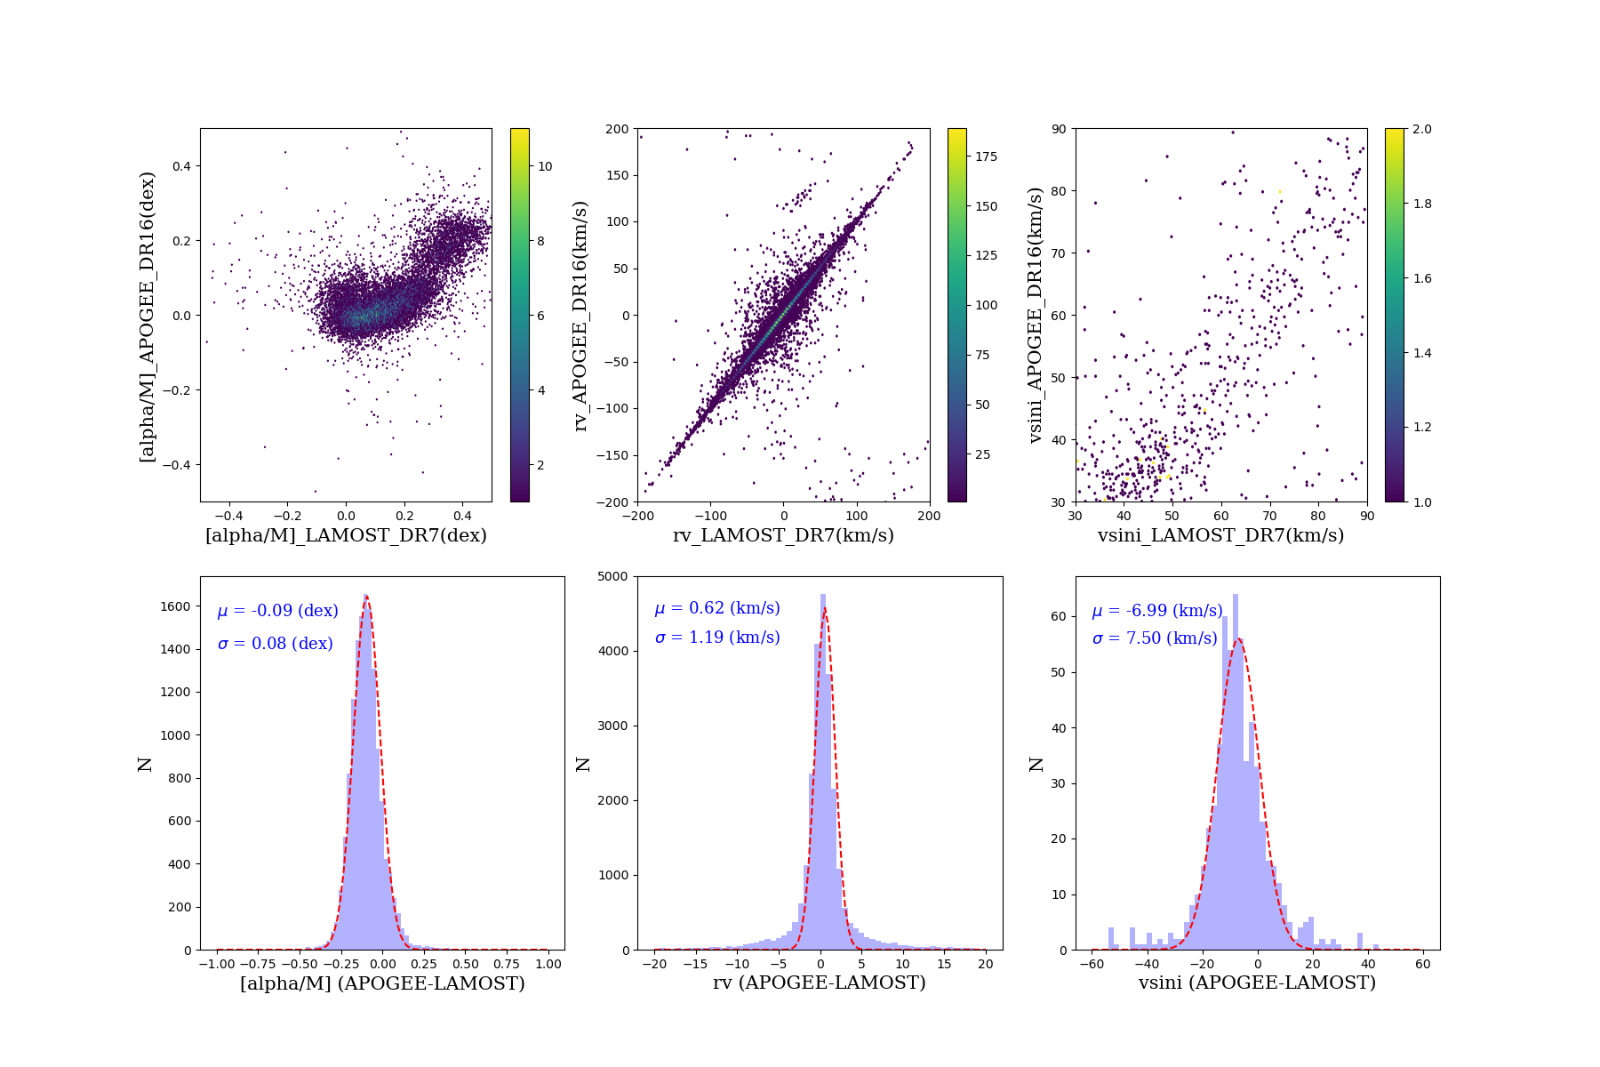
(3). The Parameter Comparisons between DR7_v2 Low-resolution Part and APOGEE
- The following figures show the comparisons of atmospherical parameters (Teff, logg, [Fe/H], [α/M] ) as well as rv between DR7_v2 low-resolution and APOGEE data. The mean values and the standard deviations of the differences are also plotted in the figures.
- 2. Statistical Analyses of Parameters for Medium-Resolution Part
(1).Distributions of Error of Atmospherical Parameters (Teff, logg, [Fe/H], [α/M]) and Radial Velocity (rv) for the combined spectra
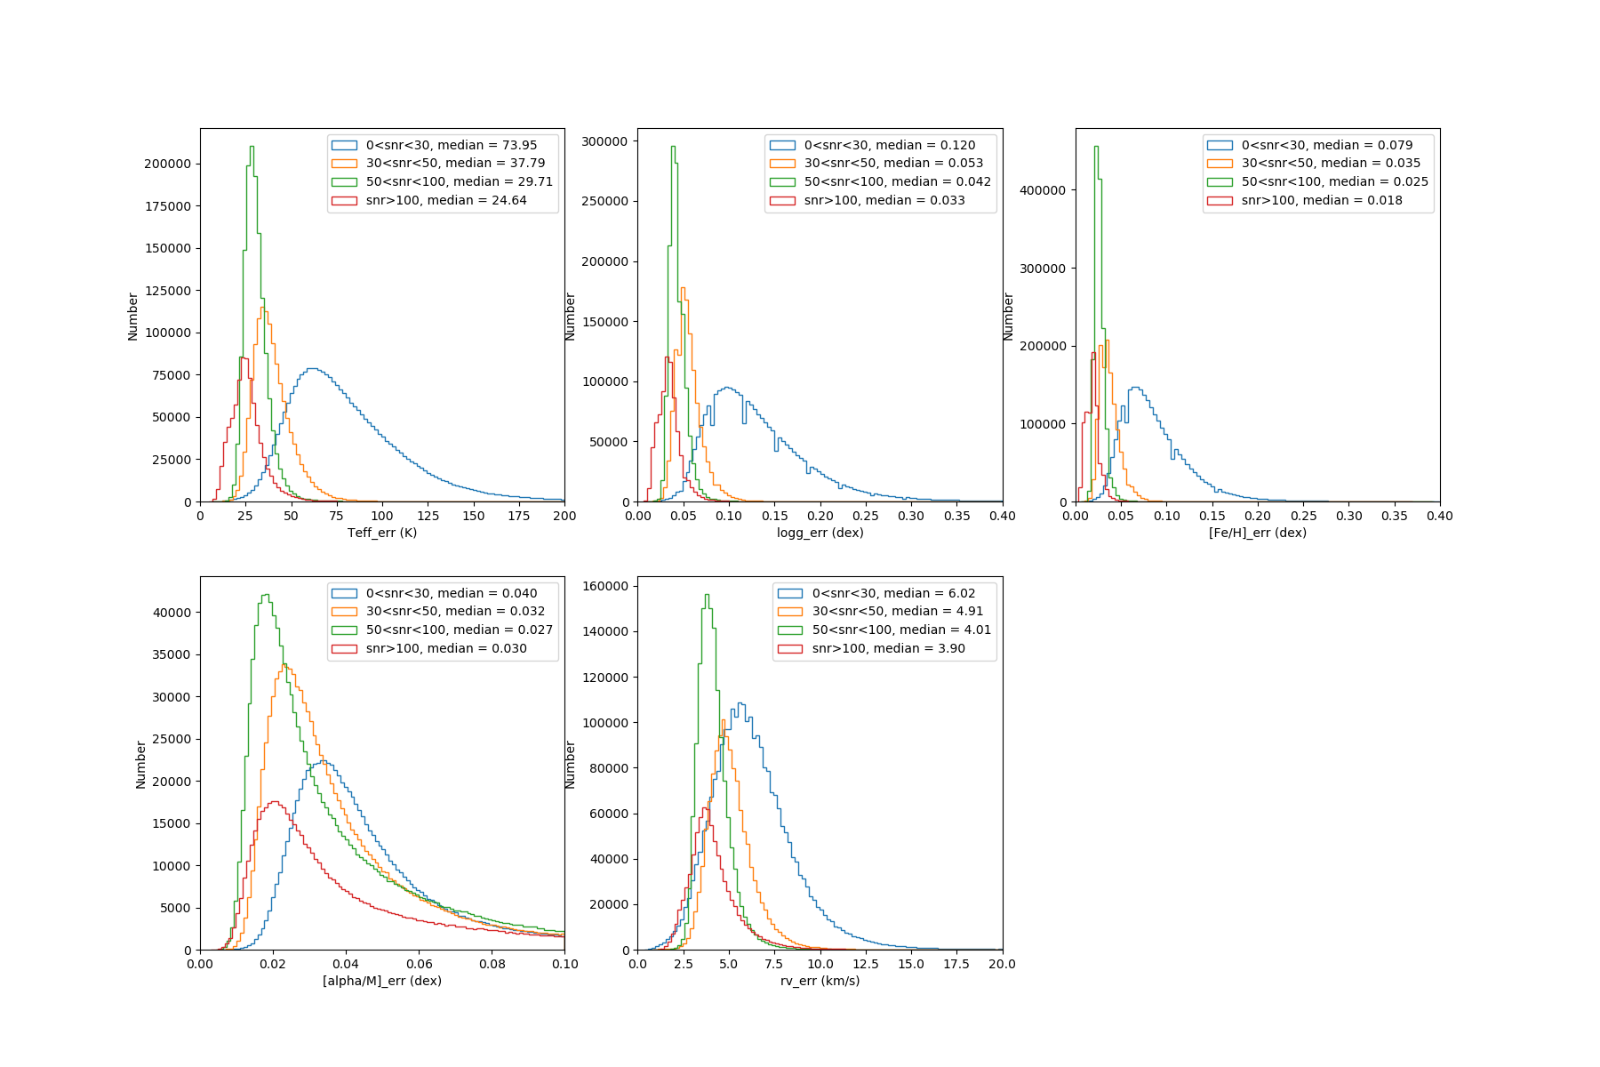
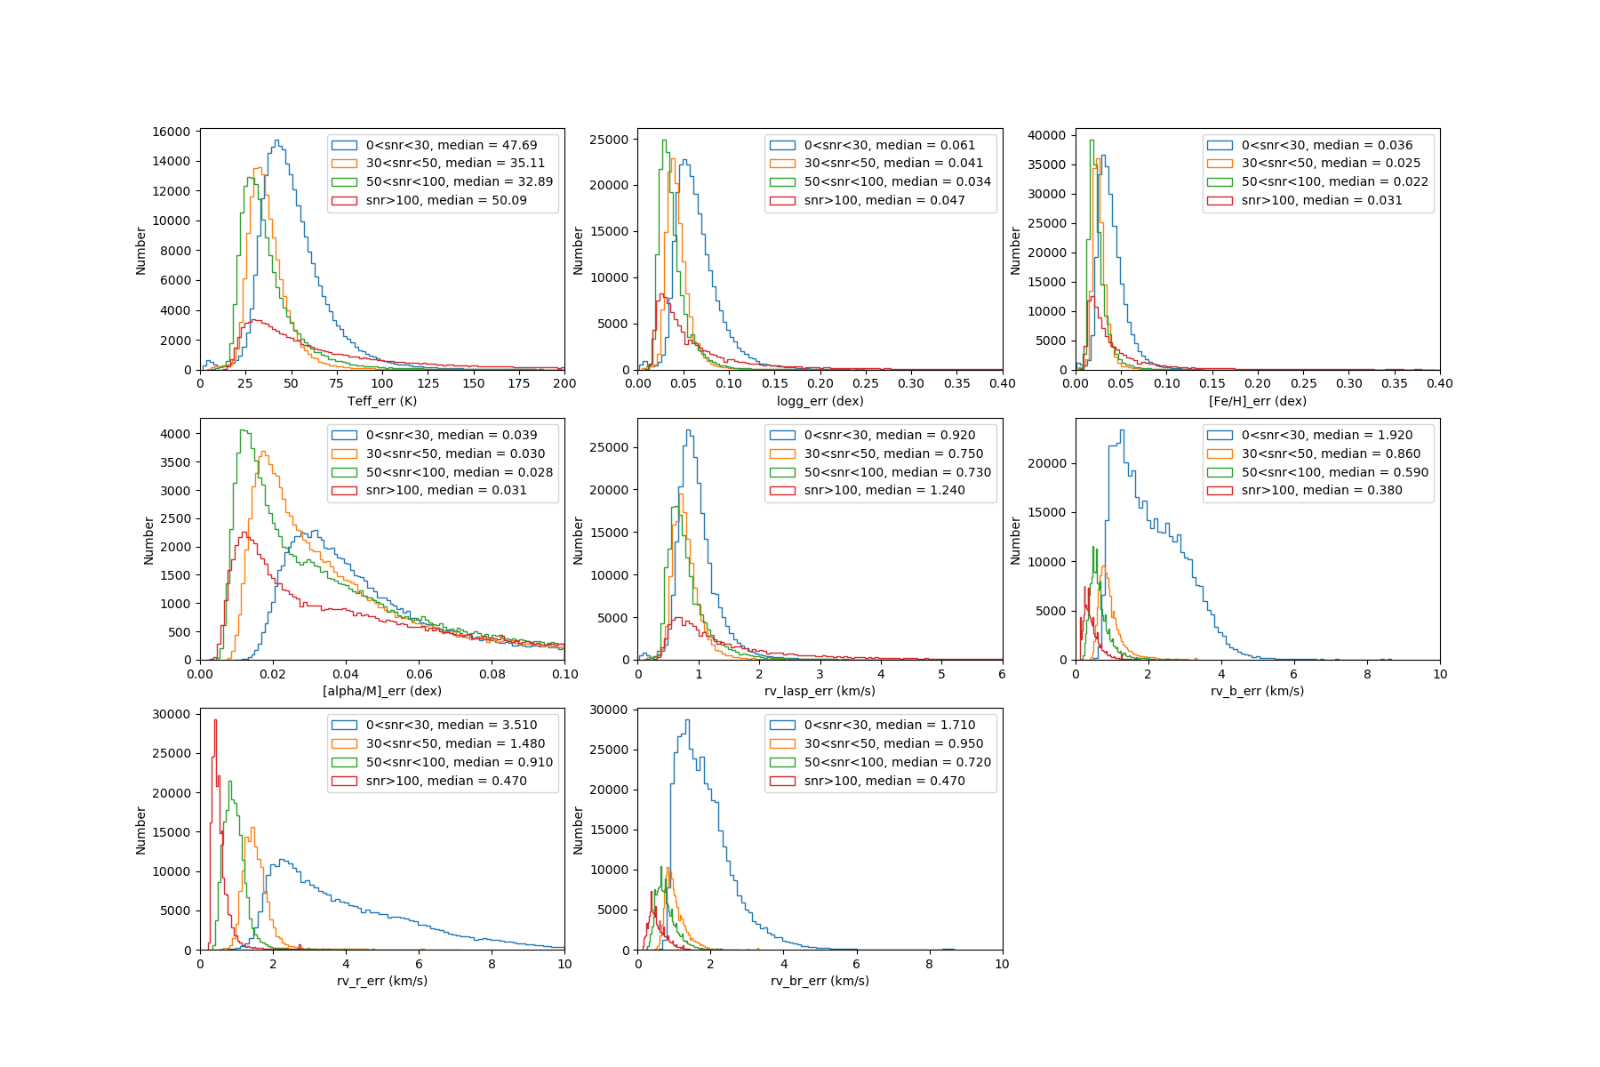
- The following figures show the distributions of error of atmospherical parameters (Teff, logg, [Fe/H], [α/M]) and rv for the combined spectra. There are four measurements of rv that are estimated by different methods. The errors of parameters are divided into four groups according to the snr, presented by different colors.
(2).The Comparisons of Parameter between DR7_v2 Medium-resolution Part and APOGEE
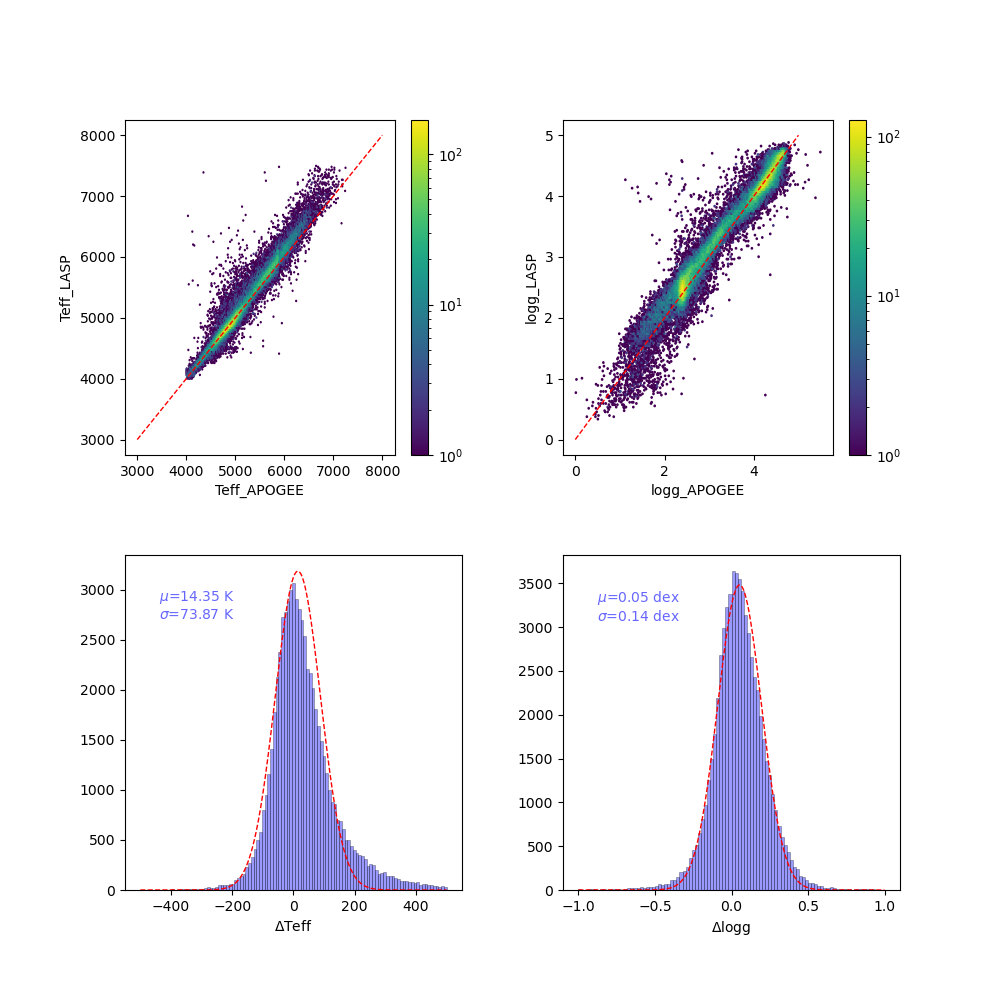
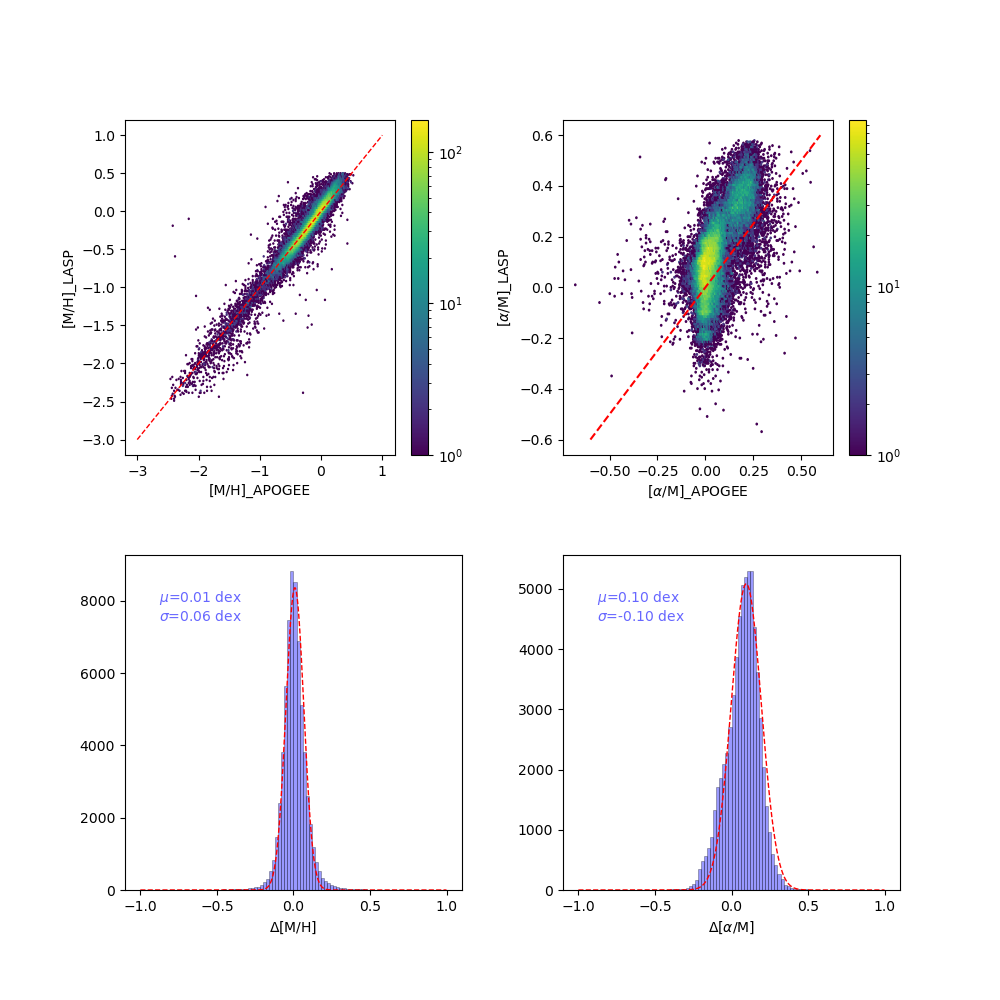
- The comparisons of atmospherical parameters (Teff, logg, [Fe/H], [α/M]), rv and vsini determined by LASP and ASPCAP are shown in the following figures. We also plot the mean values and the standard deviations of the differences of the parameters in the figures.
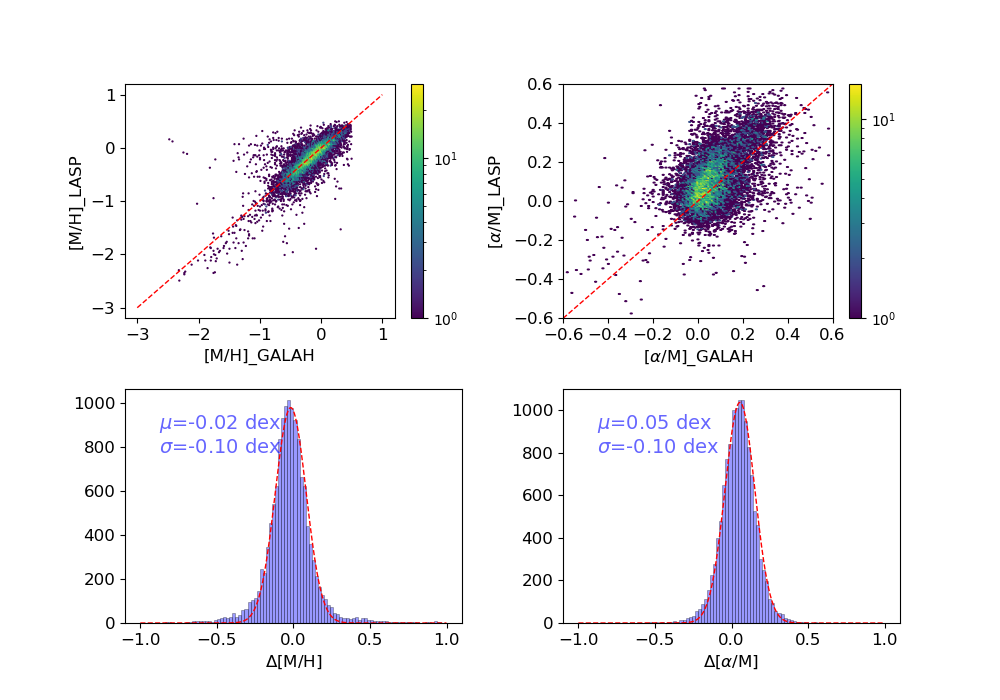
(3).The Comparisons of Parameter between DR7_v2 Medium-resolution Part and GALAH
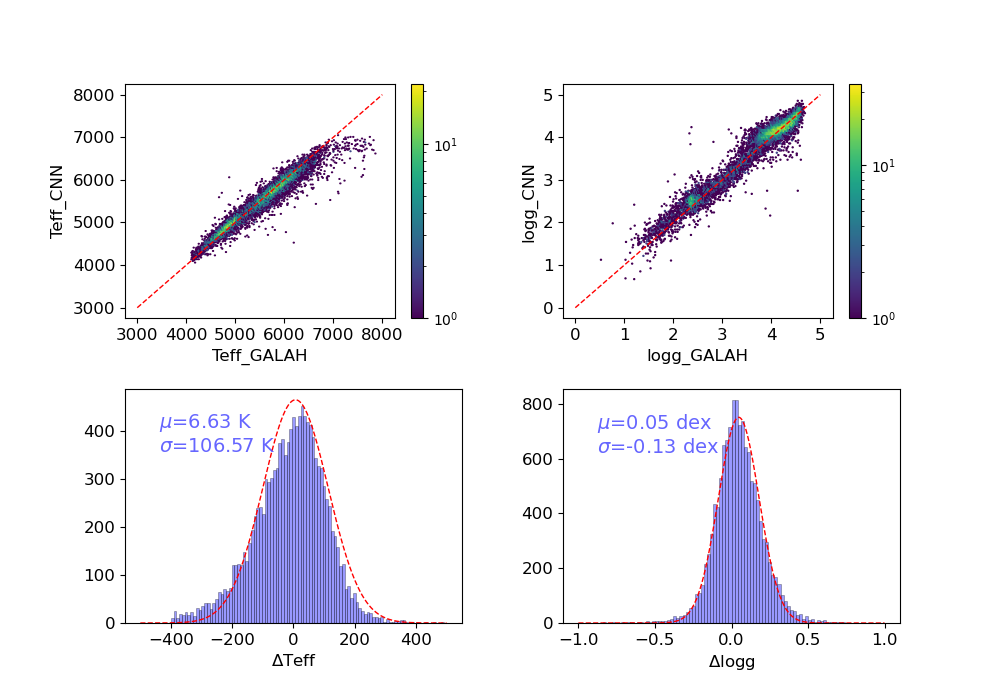
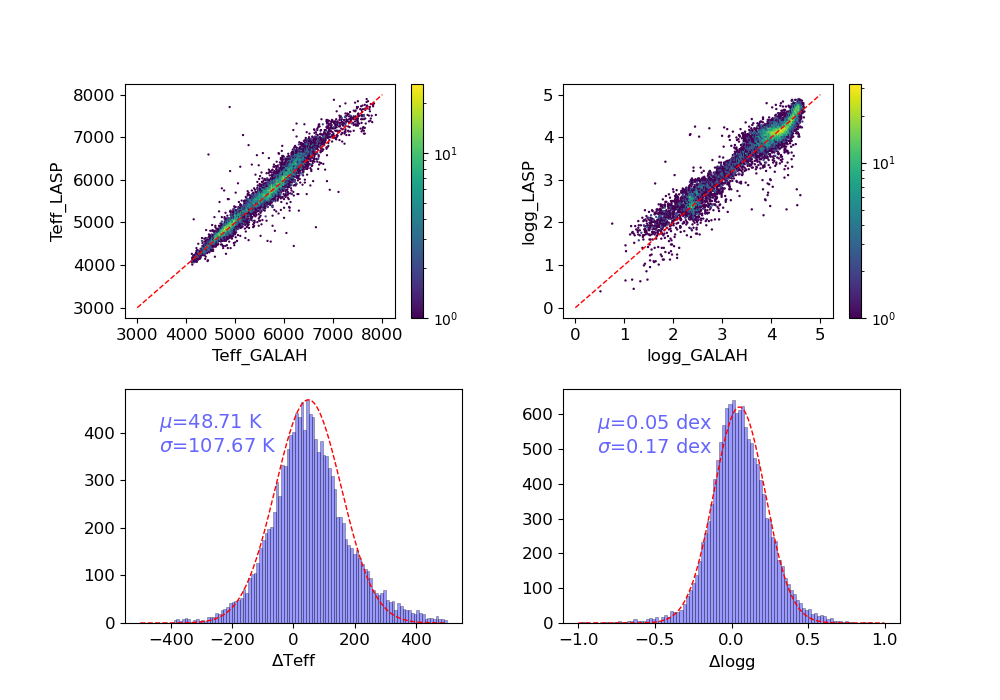
The comparisons of atmospherical parameters (Teff, logg, [Fe/H] and [α/M]) determined by LASP and GALAH DR3 are shown in the following figures. We also plot the mean values and the standard deviations of the differences of the parameters in the figures.
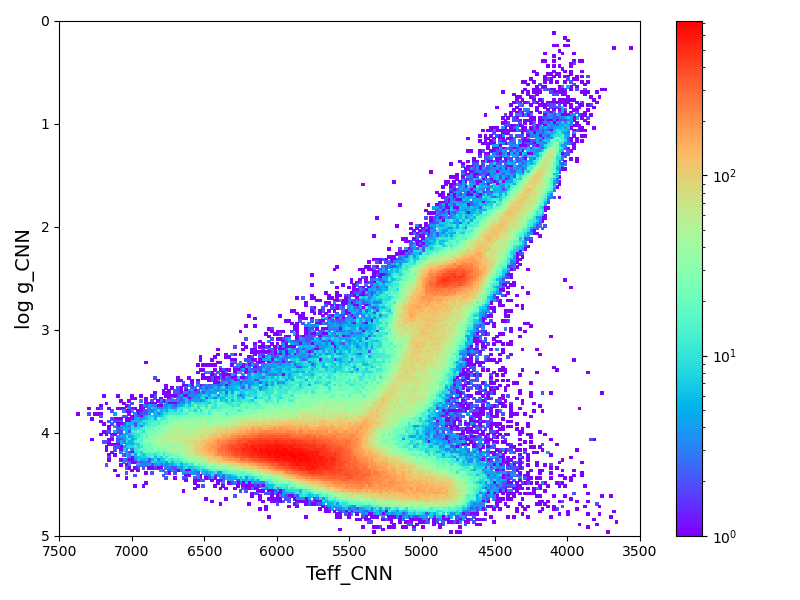
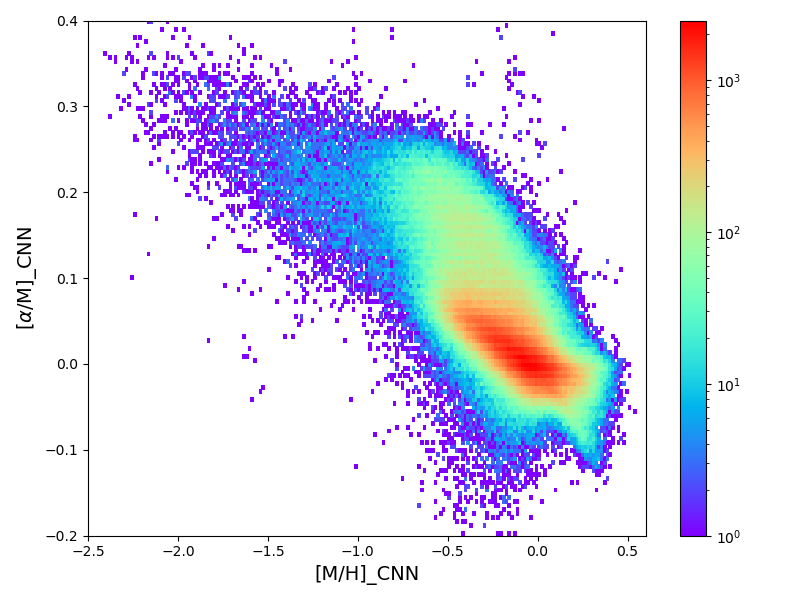
(4). Distributions of Atmospherical Parameters (Teff, logg, [M/H], and [α/M]) estimated by CNN
- We also provide another set of atmospherical parameters including Teff, logg, [M/H] and [α/M], which is estimated by the convolutional neural network (CNN) method. The Teff vs. logg diagram and [M/H] vs. [α/M] diagram for the combined spectra of DR7_v2 are shown in the following figure.
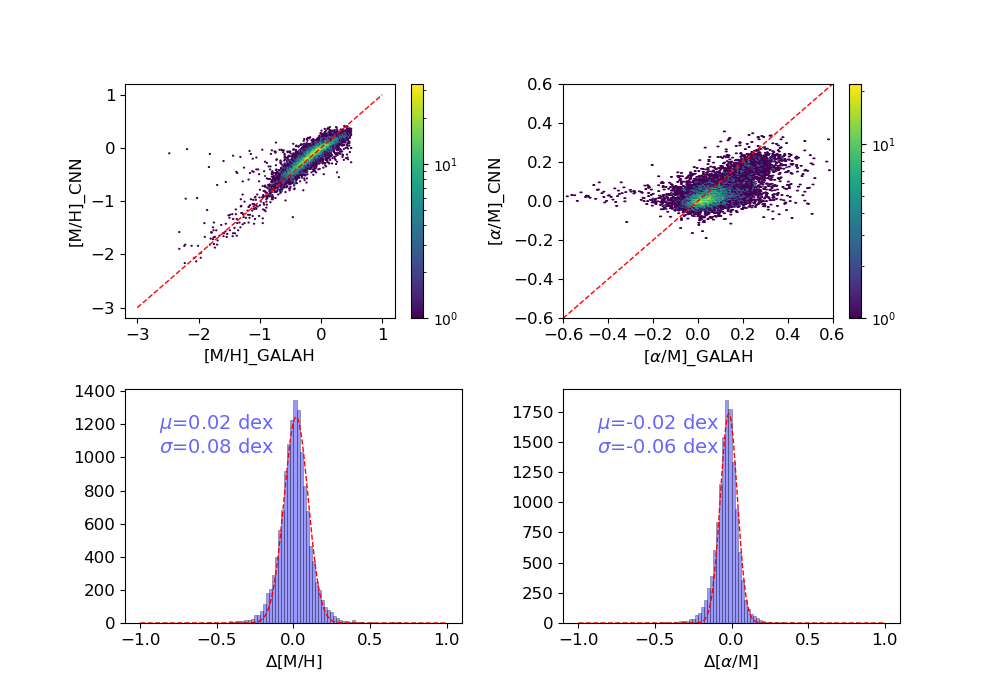
The comparisons of atmospherical parameters (Teff, logg, [Fe/H] and [α/M]) determined by CNN and GALAH DR3 are shown in the following figures. We also plot the mean values and the standard deviations of the differences of the parameters in the figures.