Release Note for LAMOST DR7
- Release Note for LAMOST DR7
- 1.Statistical Analyses of Parameters for Low-Resolution Part
- 2.Statistical Analyses of Parameters for Medium-Resolution Part
Release Note for LAMOST DR7
LAMOST DR7 which is released to domestic users in March of 2020 consistes of two components: the low-resolution part and the medium-resolution part. We make analyses of the parameters of DR6 for low-resolution and medium resolution data respectively, which are described in detail in the following.
1.Statistical Analyses of Parameters for Low-Resolution Part
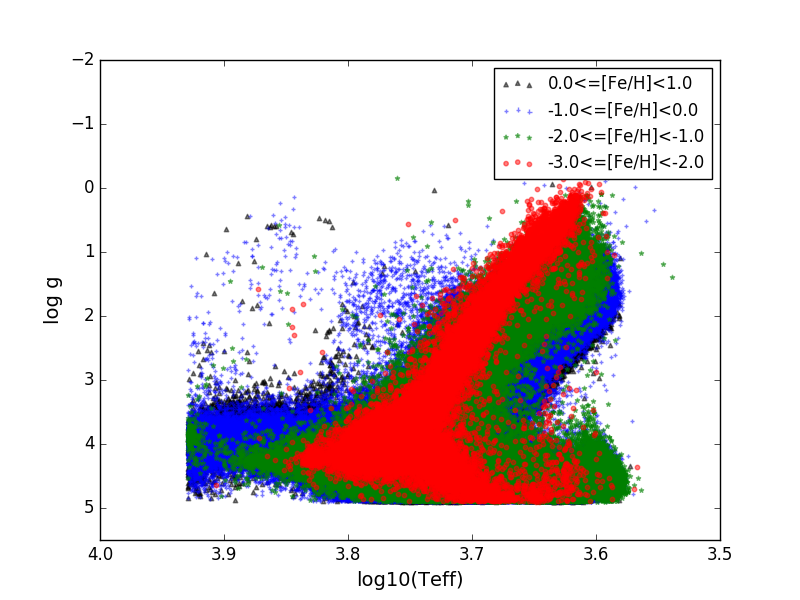
(1).Distributions of Atmospherical Parameters (Teff, logg, [Fe/H]) and Radial Velocity (rv)
The atmospherical parameter distribution of DR7 is shown as follows. Metallicity bins are represented by different colors.
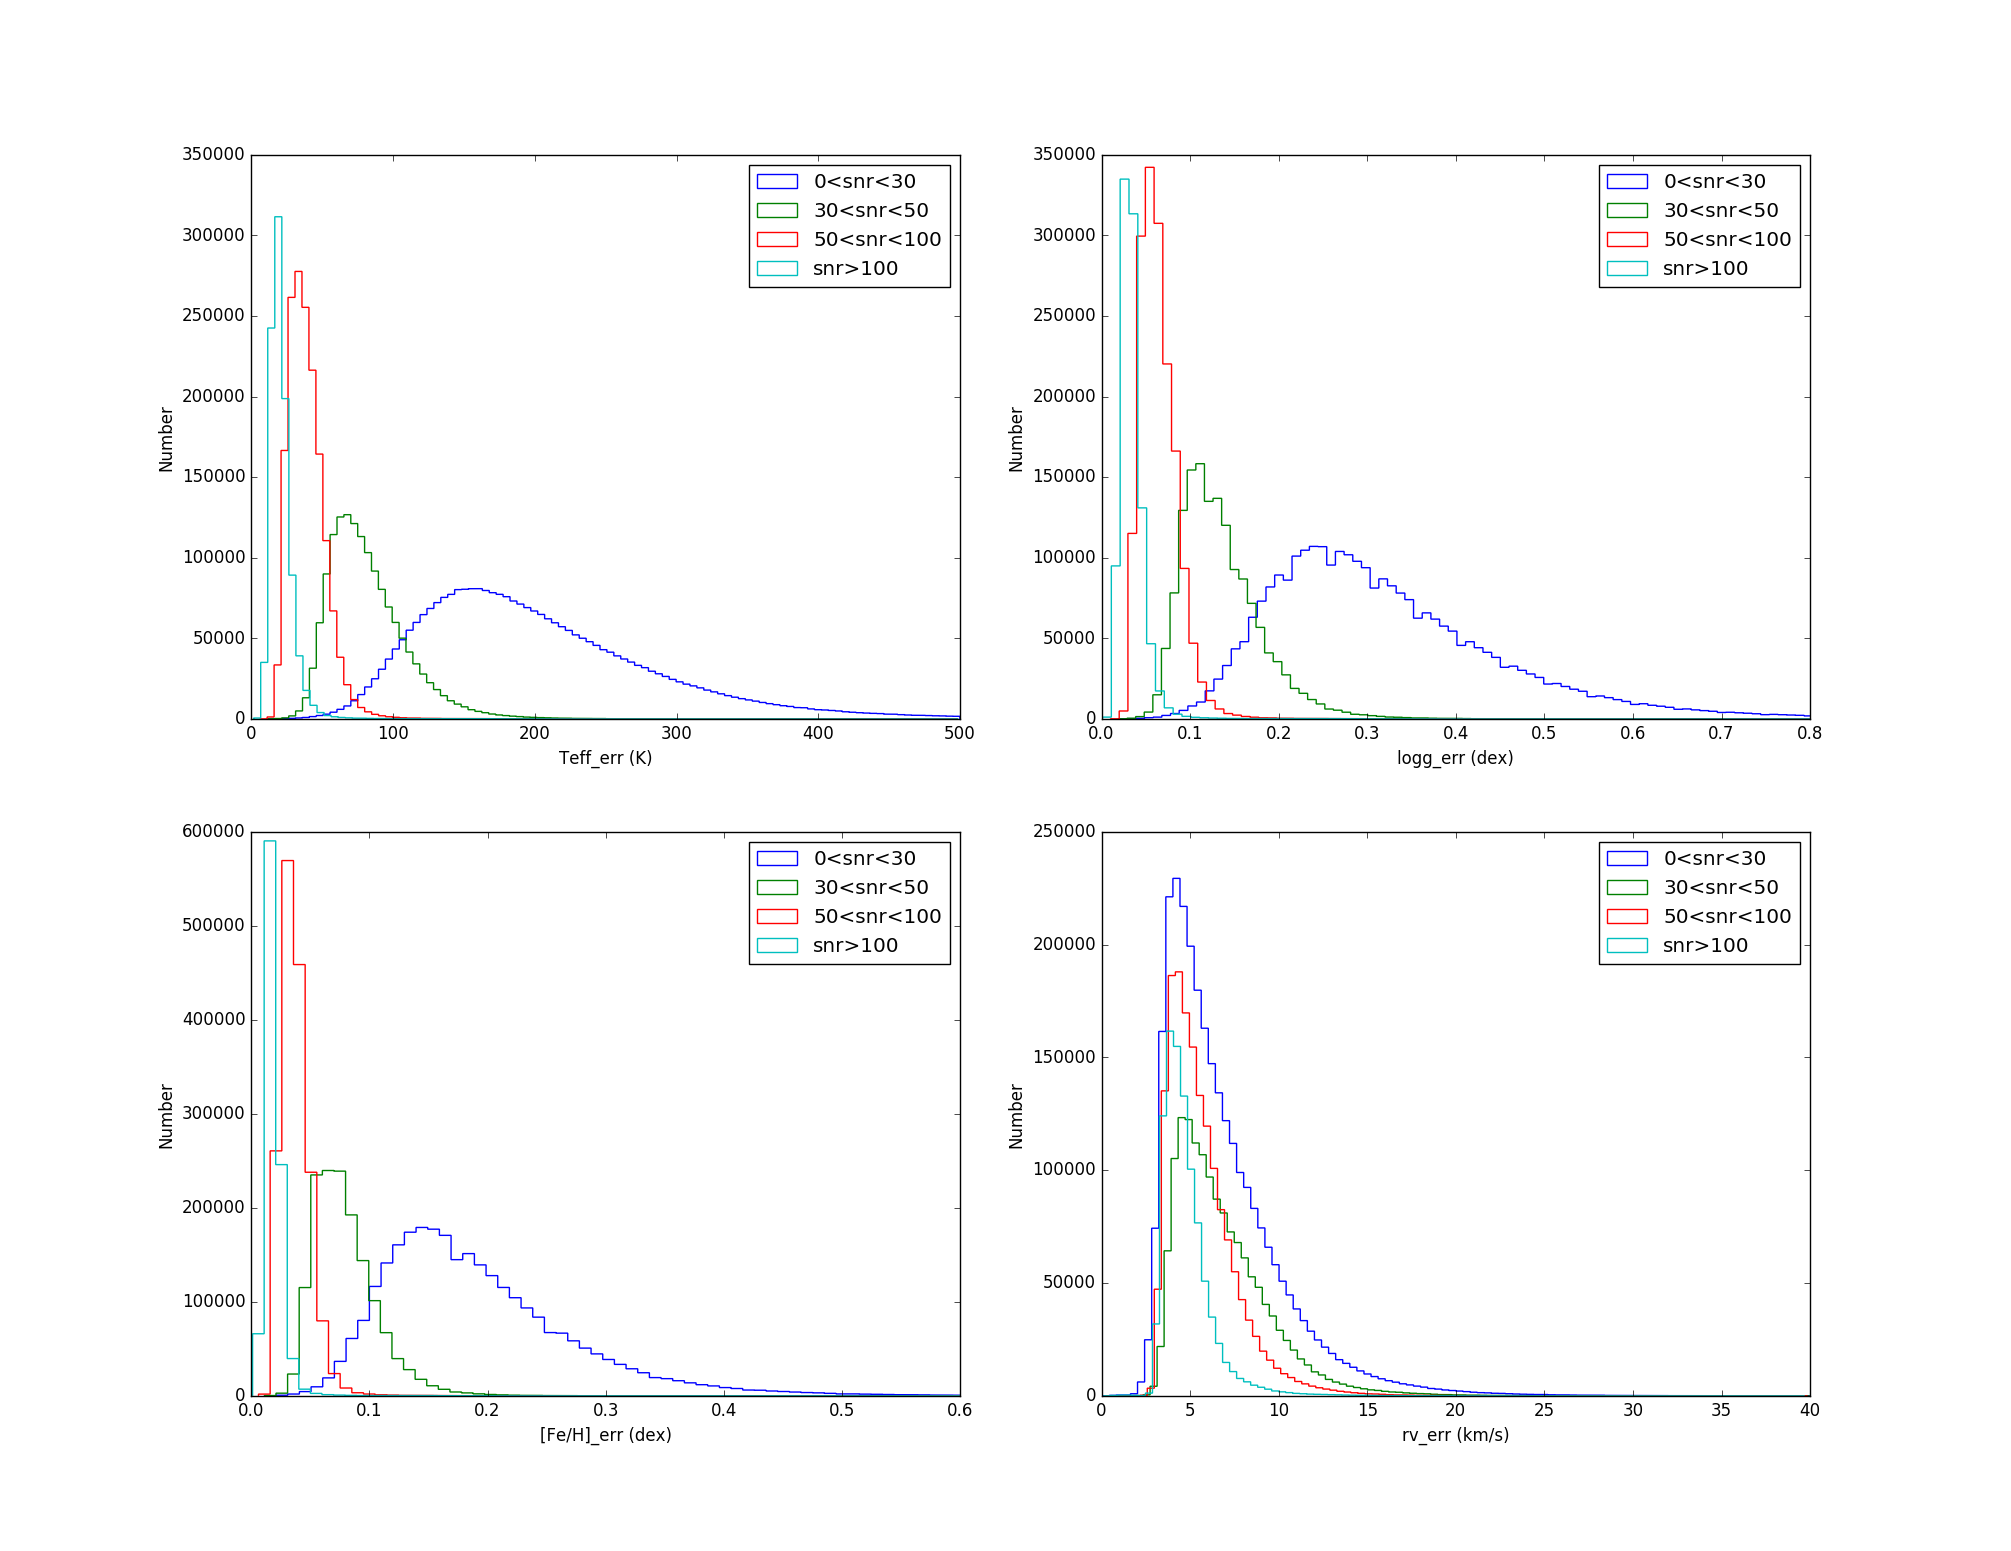
The following diagrams show the distributions of errors of atmospherical parameters (Teff, logg, [Fe/H]) as well as rv in different SNR of r band (snr)) bins.
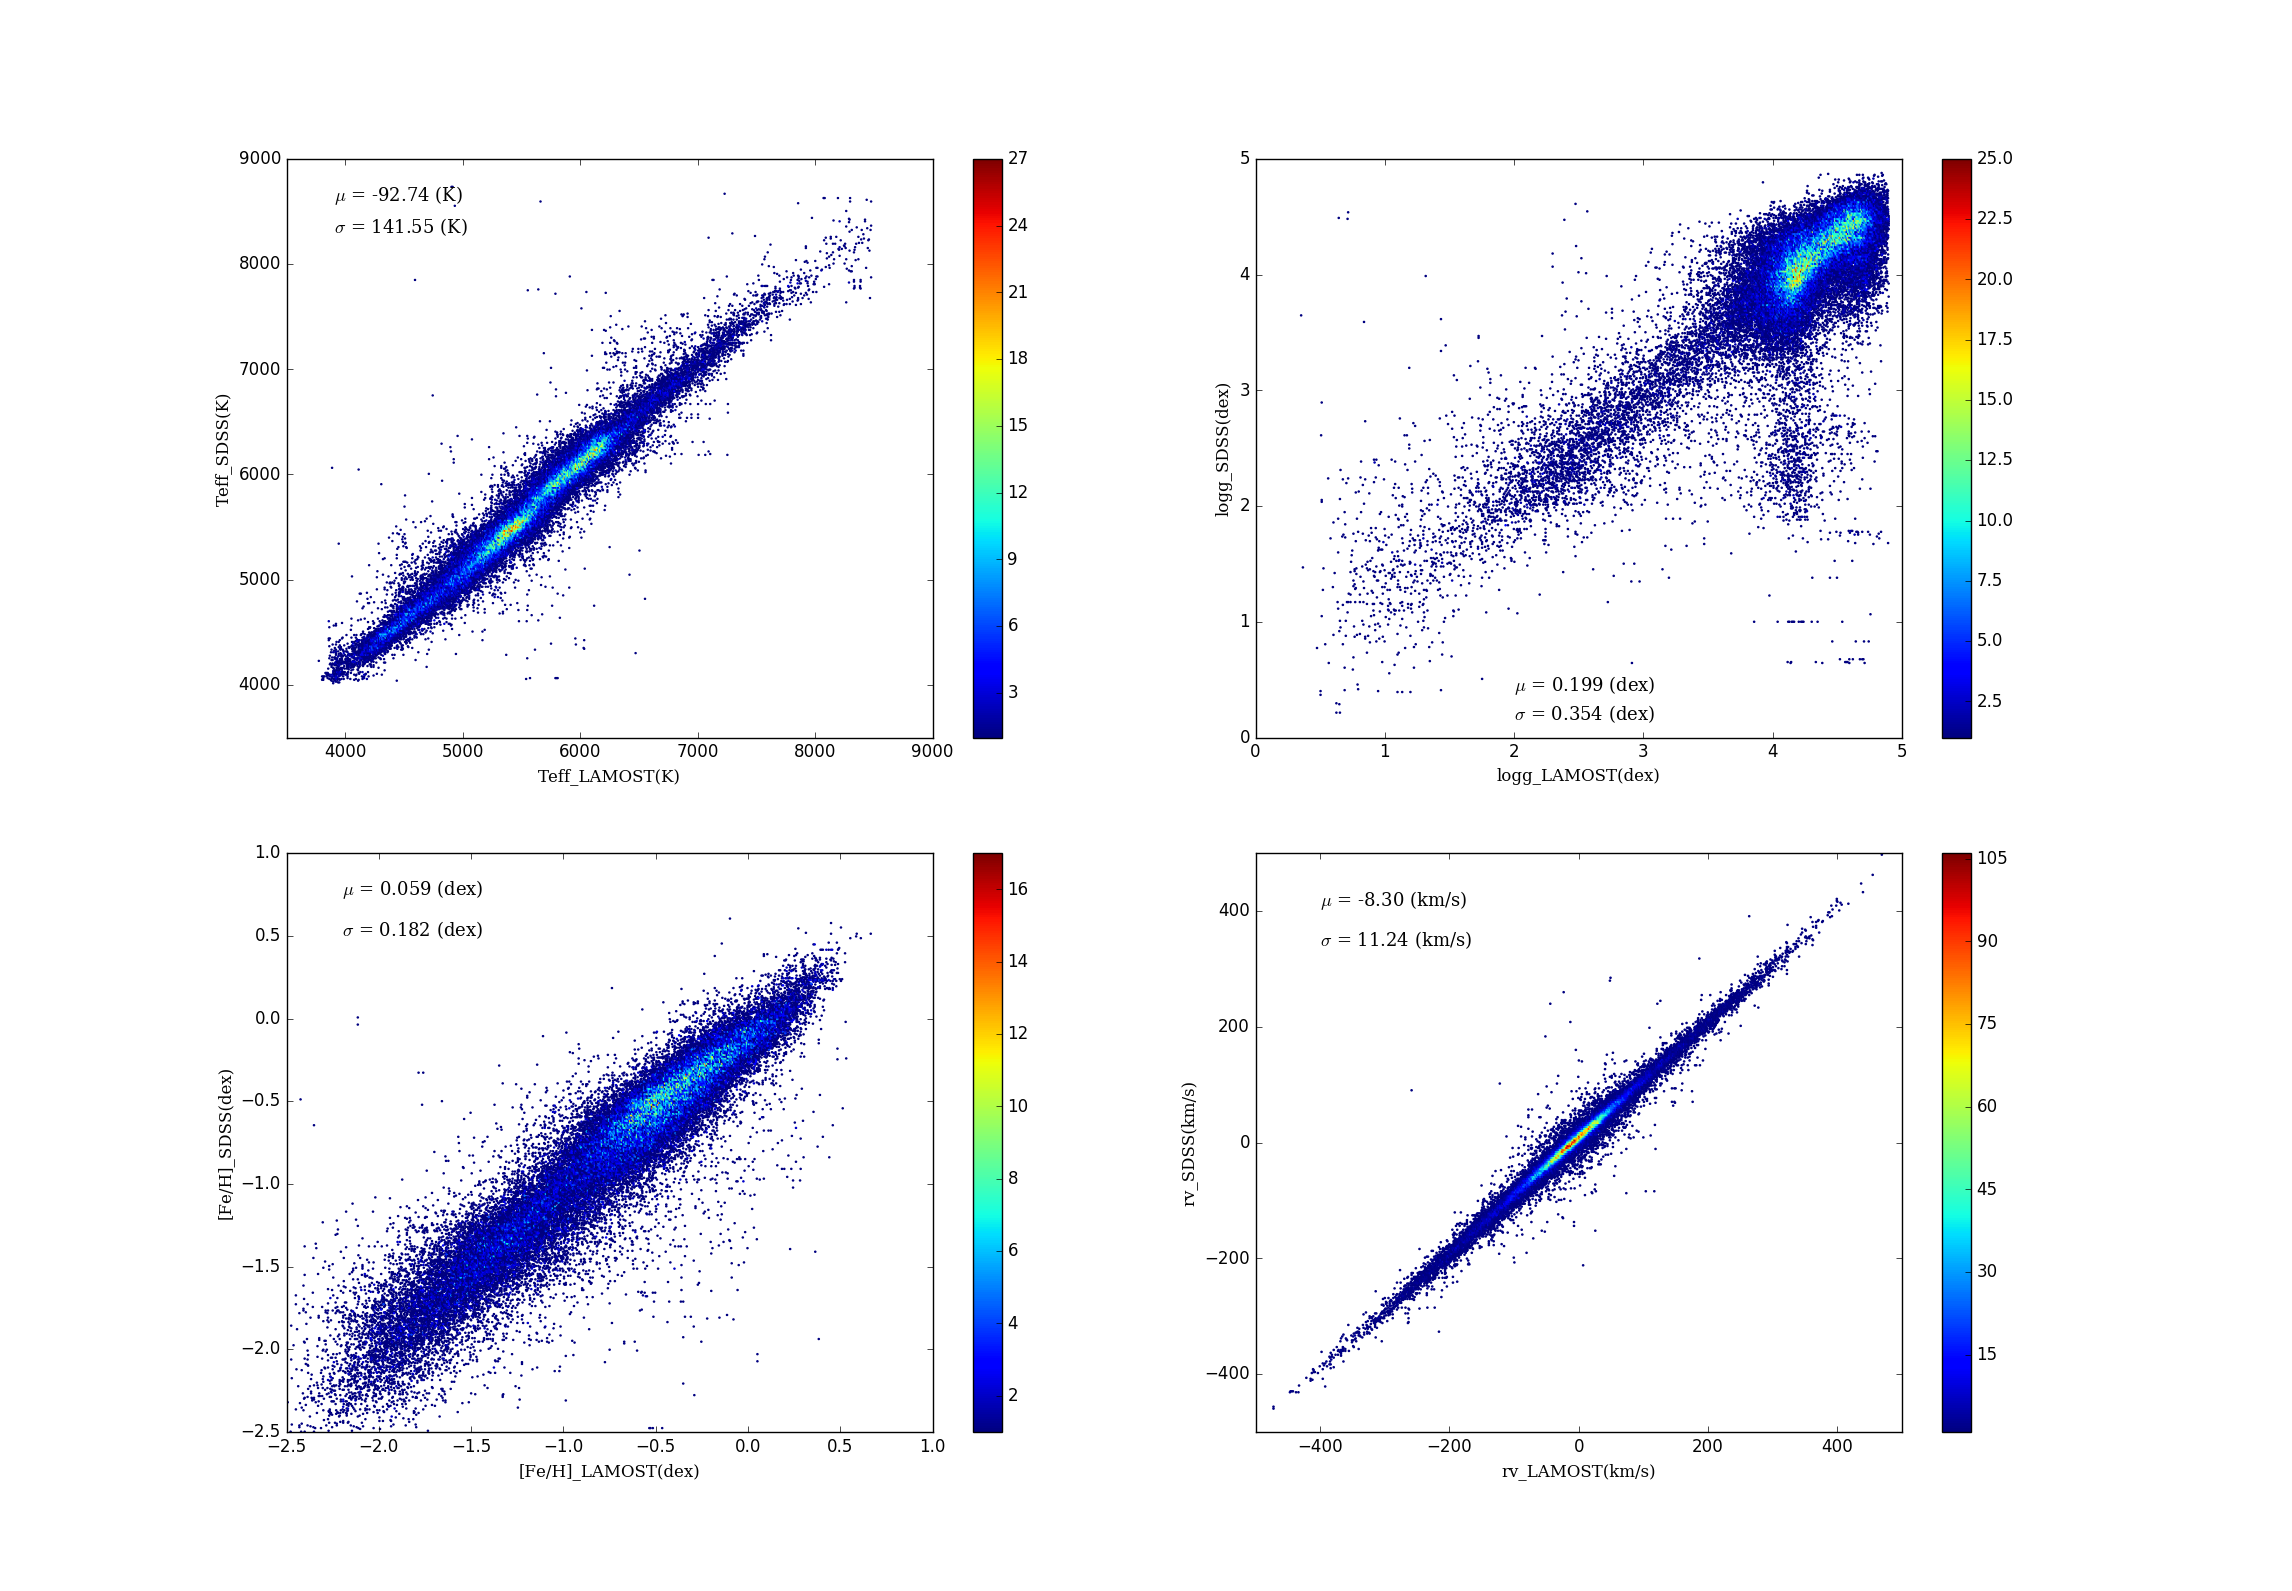
(2).The Parameter Comparisons between DR7 Low-resolution Part and SDSS
The following figures show the comparisons of atmospherical parameters (Teff, logg, [Fe/H]) as well as rv between DR7 low-resolution data and SDSS DR15. The mean values and the standard deviations of the differences are also plotted in the figures. For the parameters of logg, a branch is seen in the top-right panel. It could be explained by the inhomogeneous distribution of the atmospherical parameters in the ELODIE library. There are holes for giants in the ELODIE library, making the estimations of the initial guess for atmospherical parameters in the giant holes inaccurate.
2.Statistical Analyses of Parameters for Medium-Resolution Part
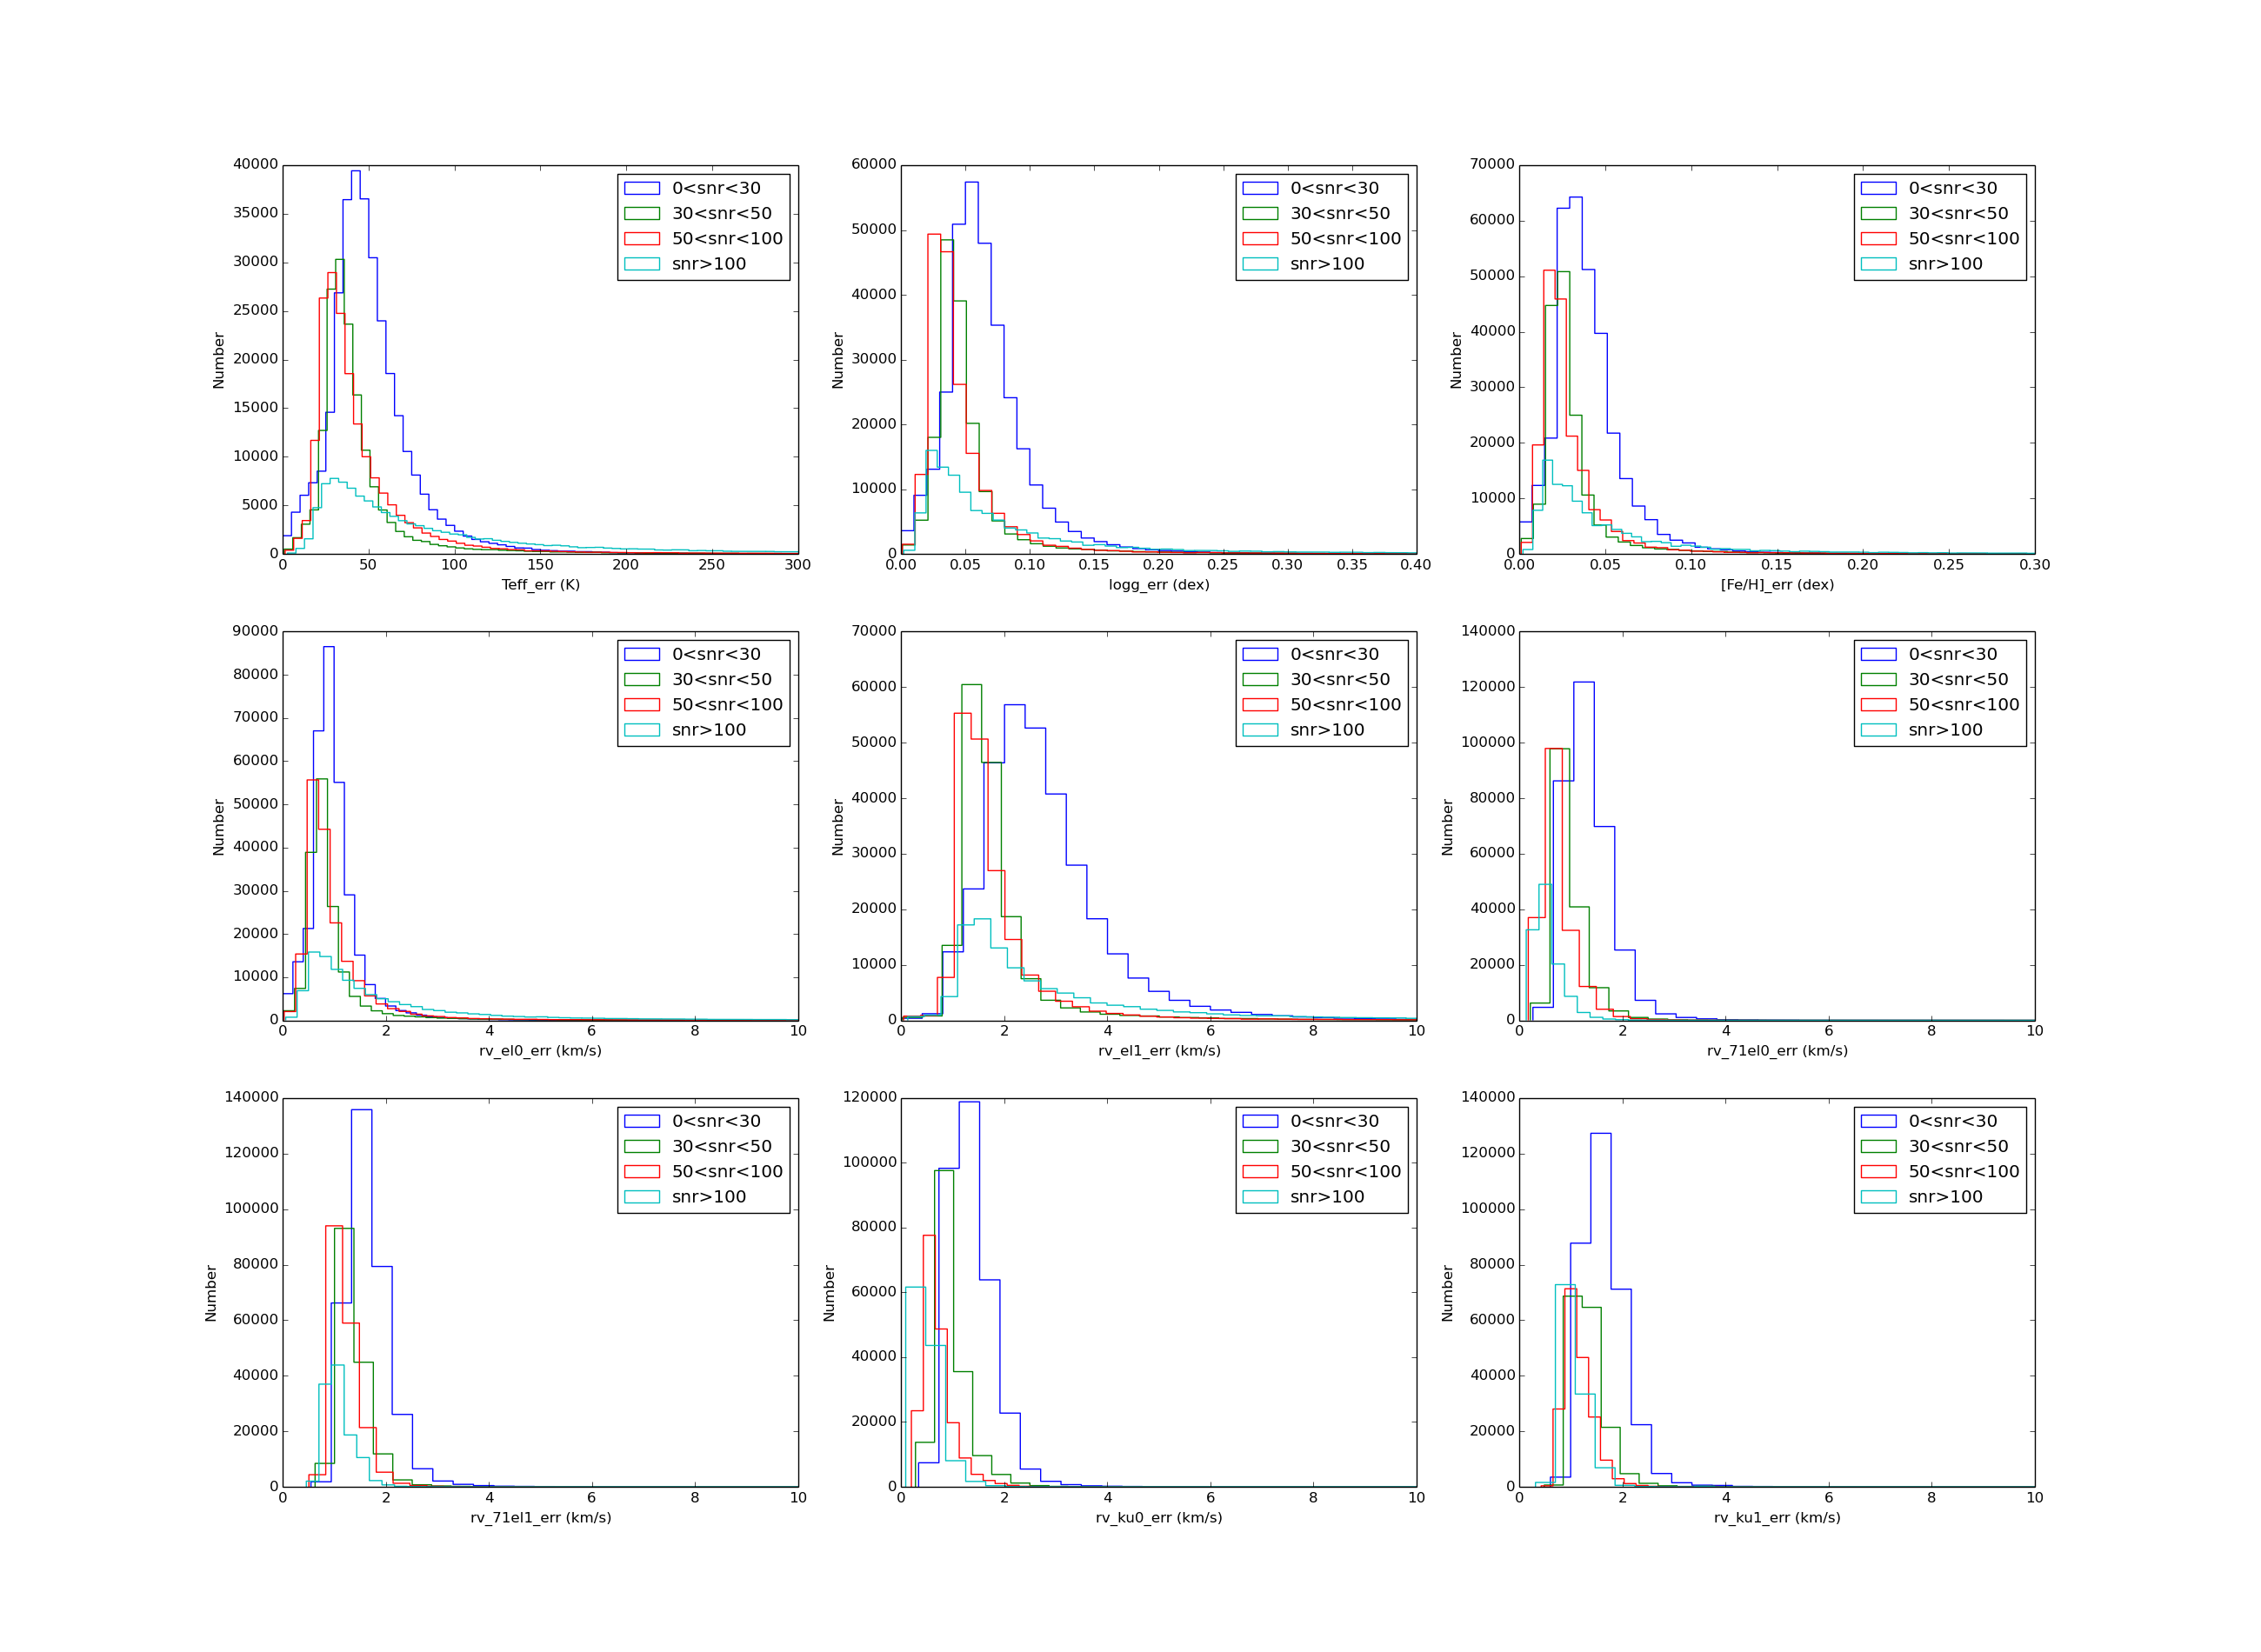
(1).Distributions of Error of Atmospherical Parameters (Teff, logg, [Fe/H]), Radial Velocity (rv) for single-exposure and combined spectra
The following figures show the distributions of error of atmospherical parameters (Teff, logg, [Fe/H]) and rv for combined spectra. The errors of parameters are divided into four groups according to the snr, presented by different colors.
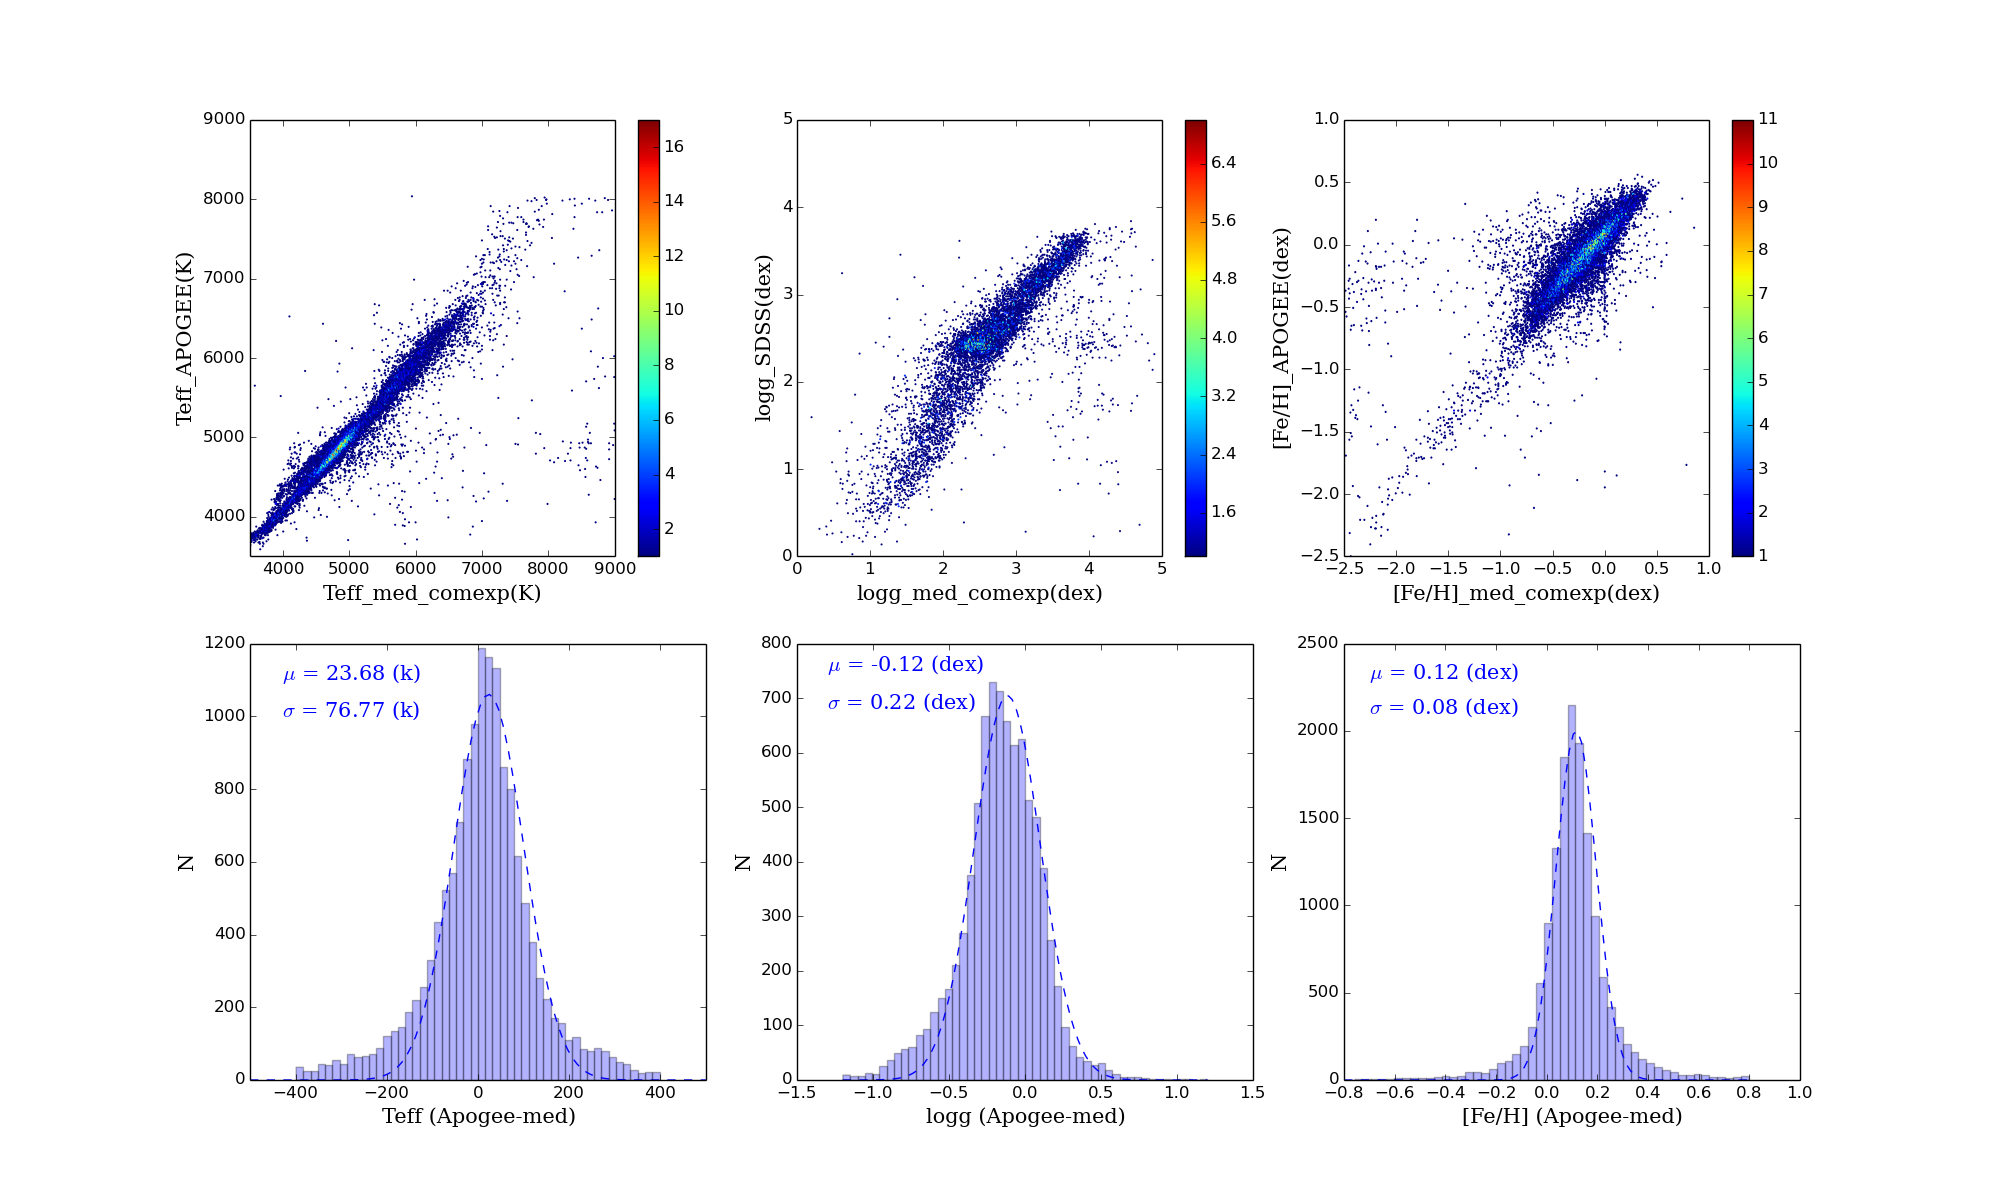
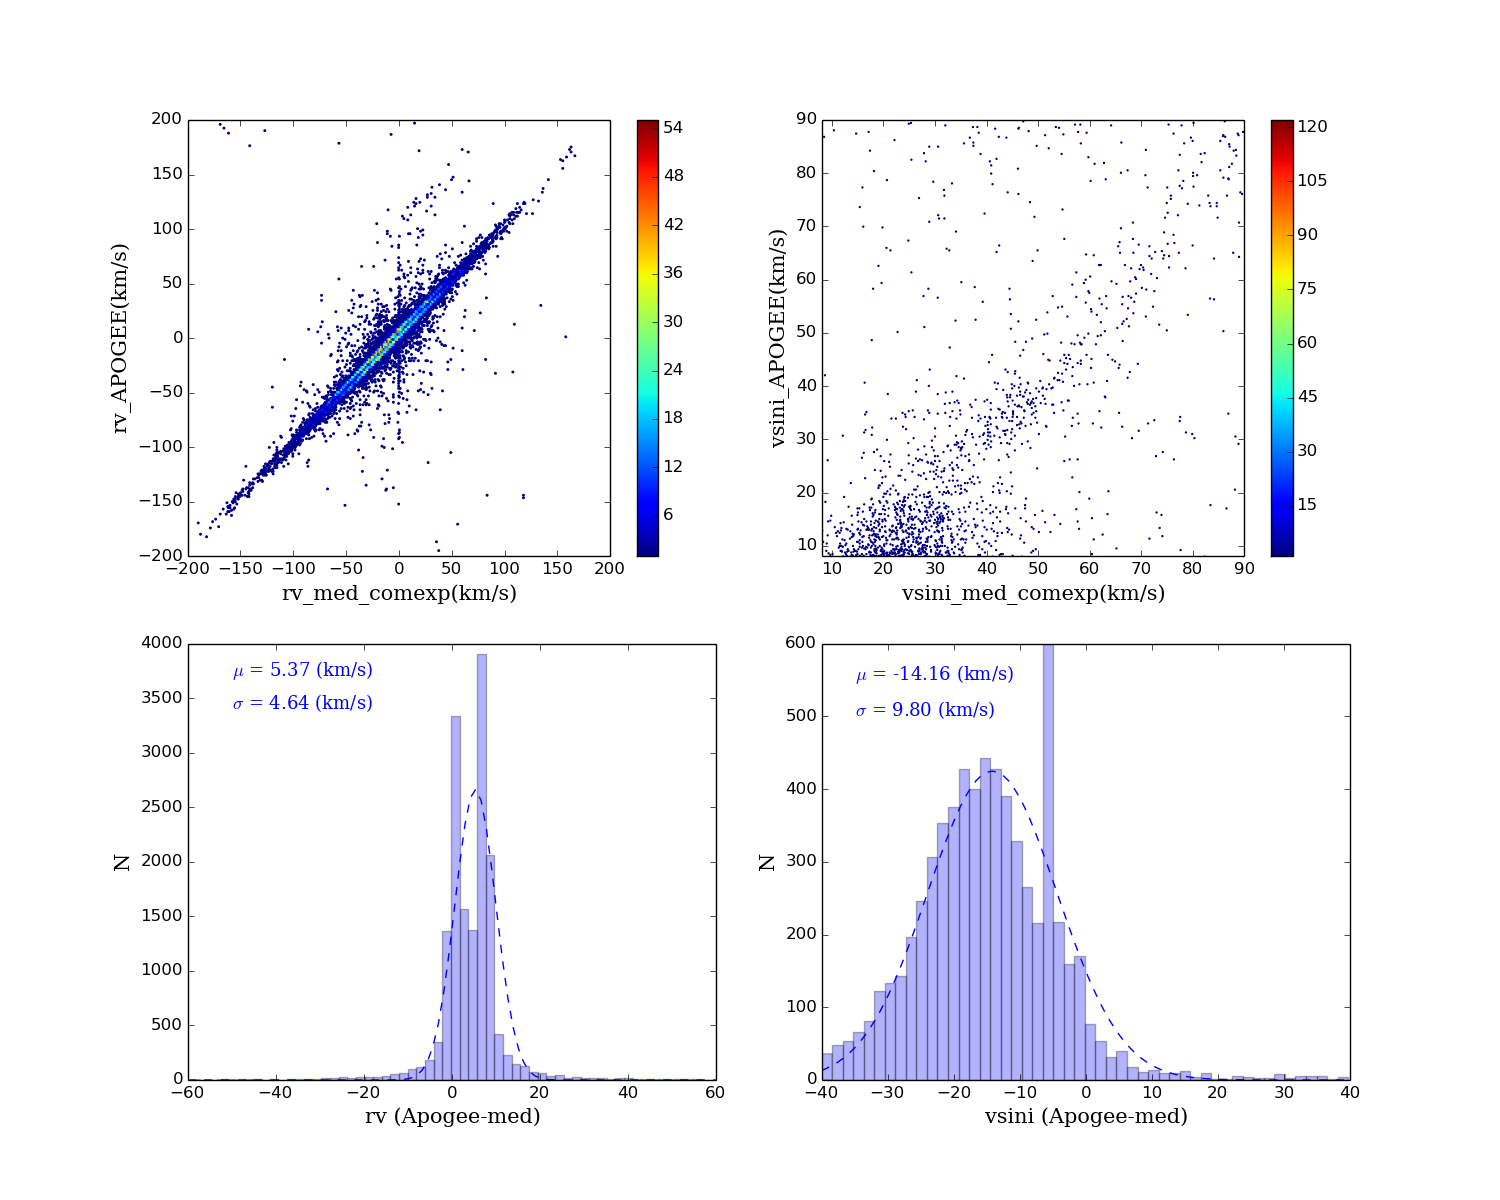
(2).The Parameter Comparisons between DR7 Medium-resolution Part and APOGEE
A comparisons of atmospherical parameters (Teff, logg, [Fe/H]), rv and vsini between DR7 Medium-resolution data and AOPGEE are shown in the following figures. We also plot the mean values and the standard deviations of the differences of the parameters in the figures.
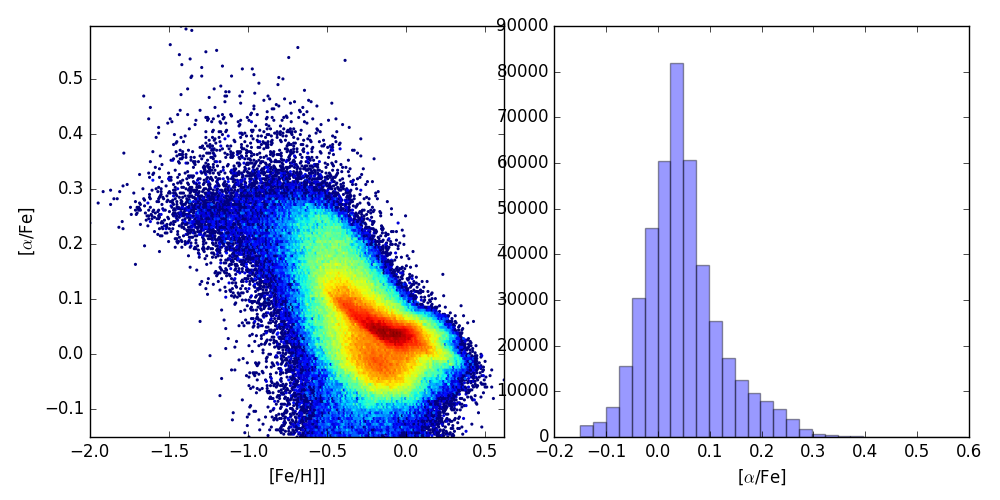
(3).Distribution of [α/Fe]
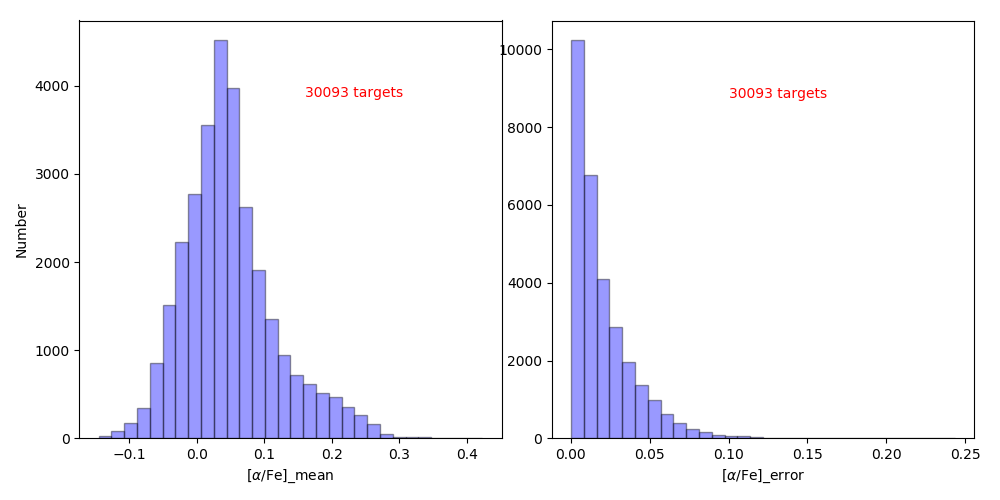
[α/Fe] is estimated by the convolutional neural network (CNN) method. The [Fe/H]-[α/Fe] diagram and the histogram of [α/Fe] drived from combined spectra are shown in the following figures.
In order to check the accuracy of estimations, we collect about 30,000 targets that have been observed more than twice. The mean values and standard deviations of [α/Fe] for targets with multiple obsevations are shown in the following figures. From the results, we can know that dispersions of more than 90% of the sample are less than 0.05 dex.
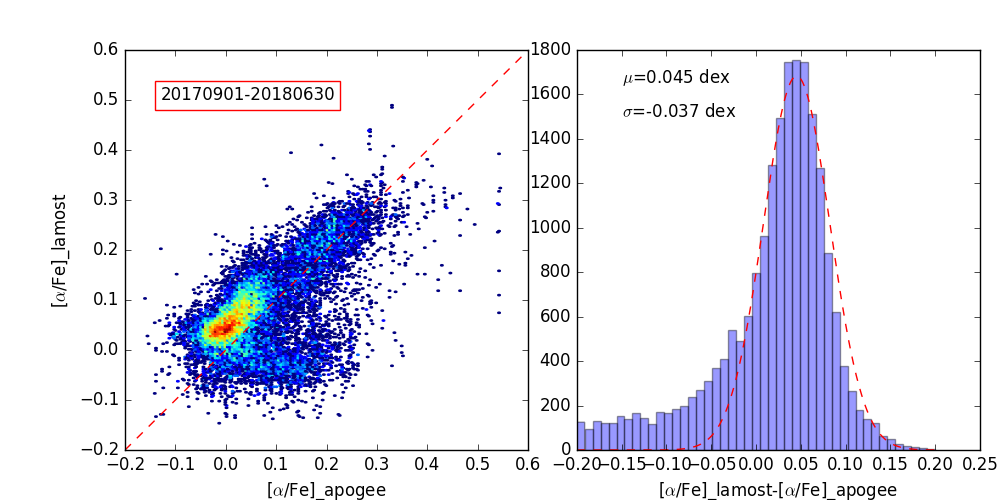
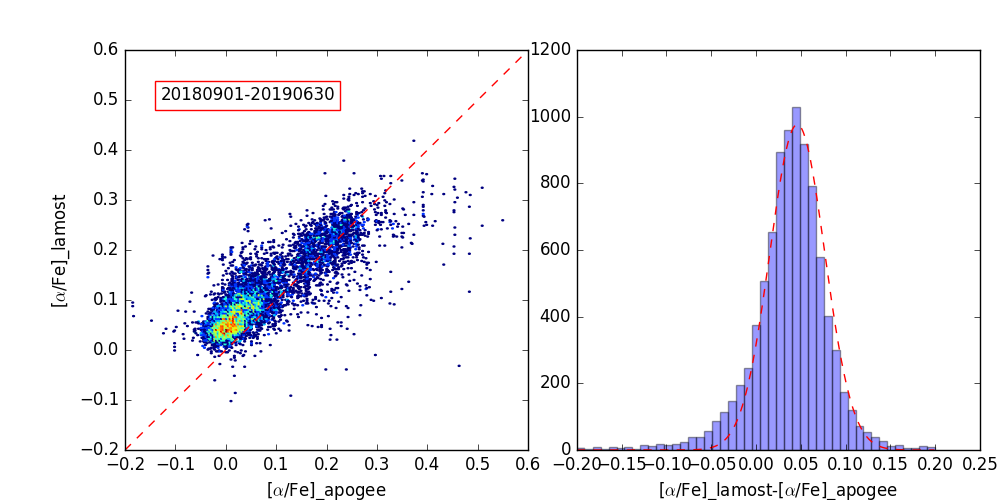
A comparison of [α/Fe] between DR7 Medium-resolution data and AOPGEE are shown in the following figures. The data is divided into two parts according to the observation dates. One group of data is observed from the first year of DR7 from September 2017 to June 2018, and the other is from September 2018 to June 2019. Seen from the top panel of the figure, we can see a small portion of outliers in the lower, which are not shown in the bottom panel. We find that these outliers are almost dwarfs of which temperatures are between 6000 K and 7000 K. We also plot the mean values and the standard deviations of the differences of the parameters in the figures.
(4).The Compaisons of [α/Fe] between DR7 and APOGEE
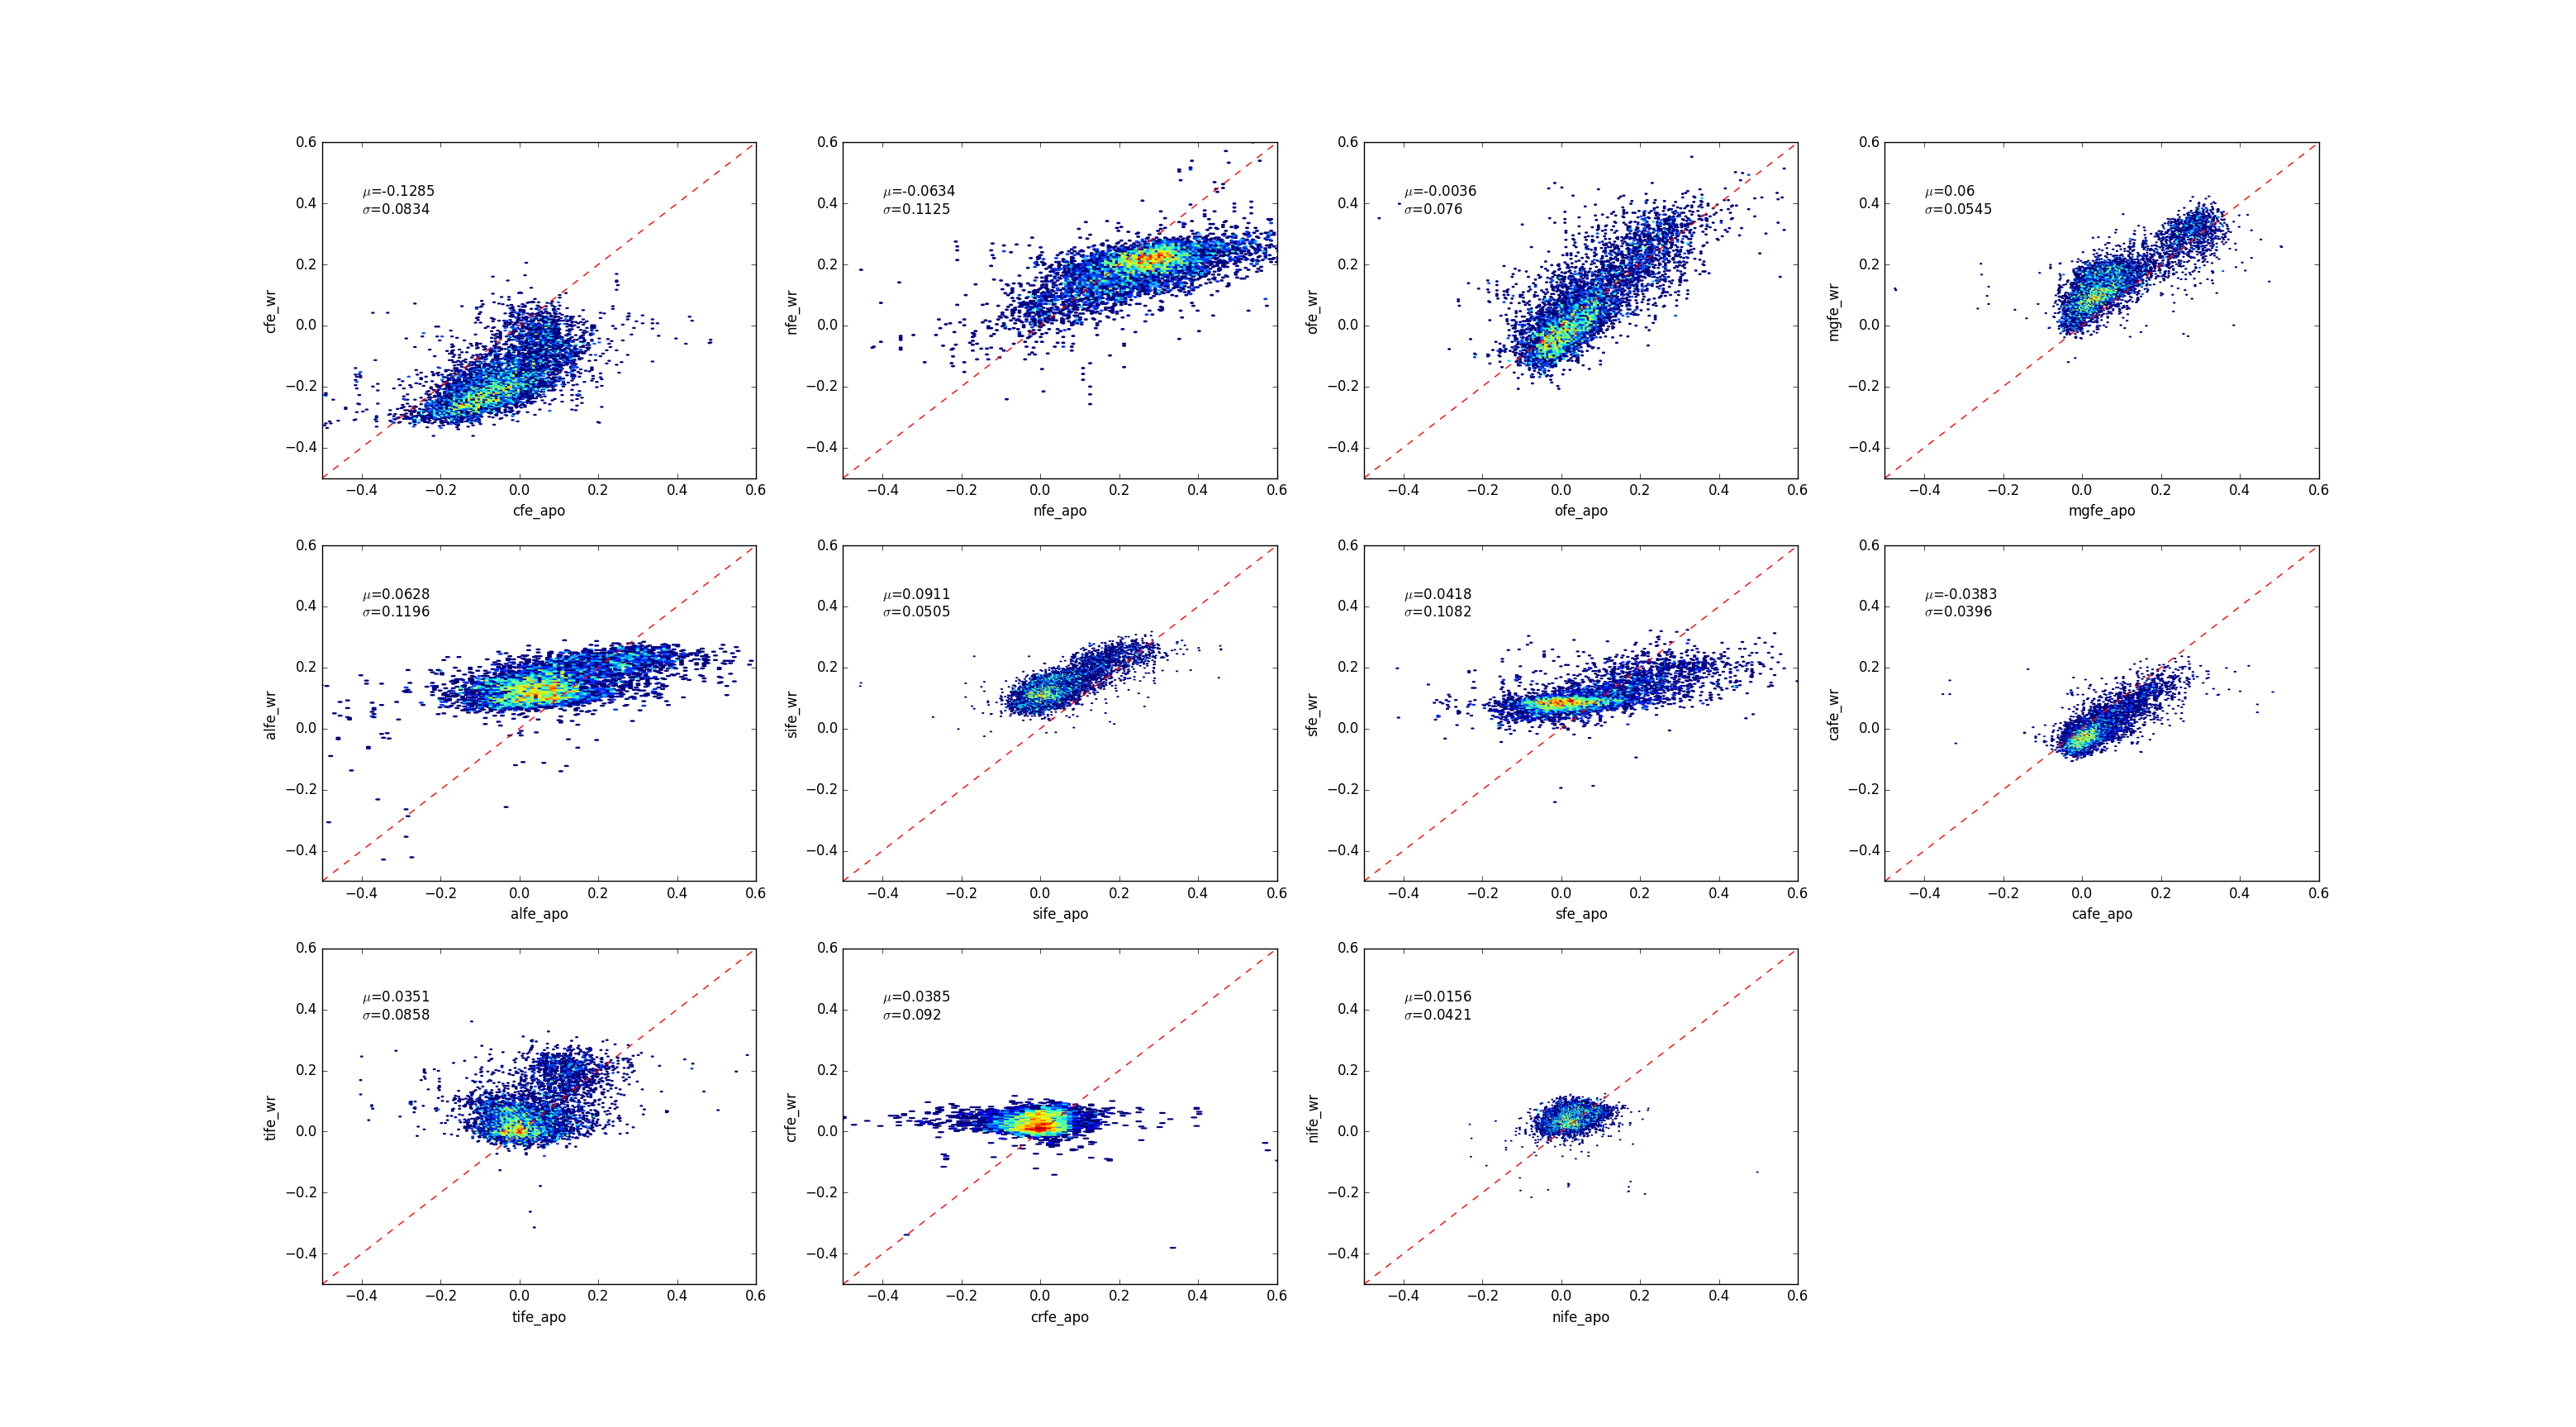
Element abundances including [C/Fe], [N/Fe], [O/Fe], [Mg/Fe], [Al/Fe], [Si/Fe], [S/Fe], [Ca/Fe], [Ti/Fe], [Cr/Fe], [Ni/Fe], and [Cu/Fe] are also provided in this data release. Comparisons of element abundances between DR7 Medium-resolution data and AOPGEE are shown in the following figures ([Cu/Fe] is not provided by APOGEE). The data is also divided into two parts which are from September 2017 to June 2018 and from September 2018 to June 2019.
There are some differences in the comparions between each year of DR7 and APOGEE due to inaccurate abundance estimations for hot dwarfs in APOGEE and the different select effects of each year of LAMOST DR7. Two branches are shown in the comparison between the first year of DR7 (20170901-20180630) and APOGEE, which are not seen the bottom panel representing the comparion between the second year of DR7 (20180901-20190630) and APOGEE. The two branches belong to two groups of stellar populations, one of which are hot dwarfs (5000 ~ 7000 K) and the other are cold giants (4000 ~ 5000 K). Two branches are not seen the second year because that only cold giants in APOGEE are observed by LAMOST in this year.
20170901-20180630 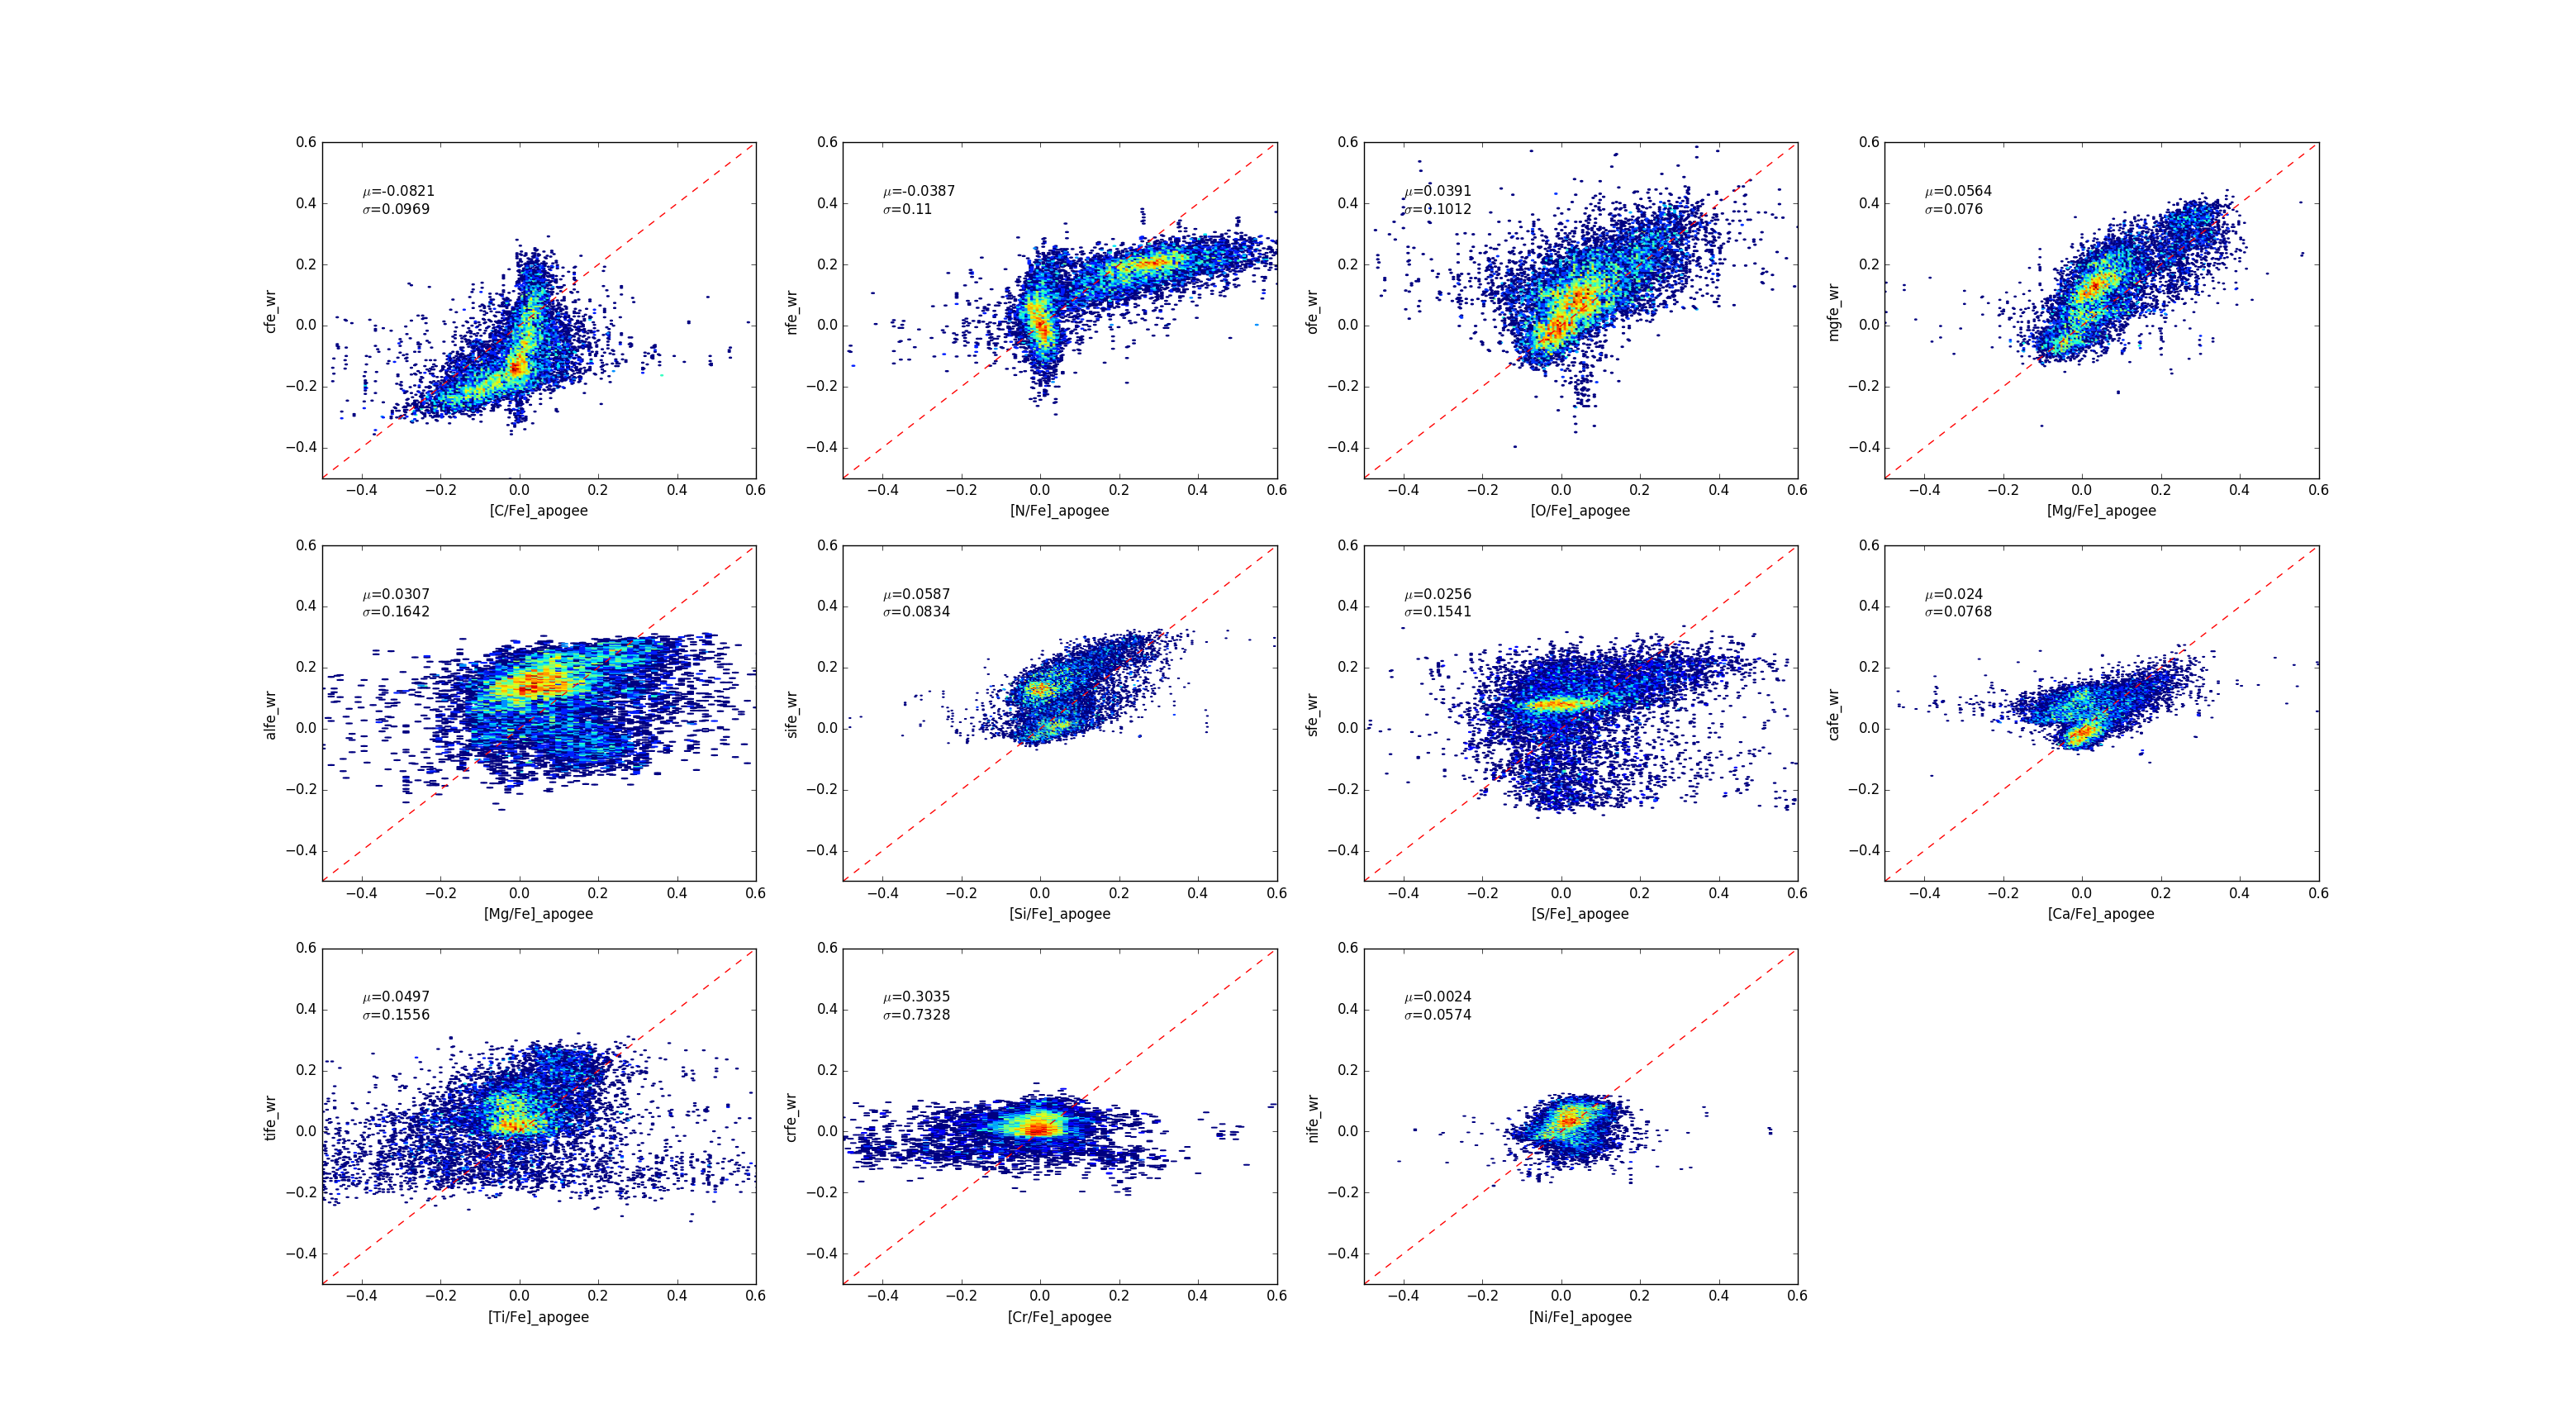
20180901-20190630