Release Notes for LAMOST DR11 v2.0 Data
- Section 1. Analyses of LASP Parameters for Low-Resolution Data
- Section 2. Analyses of LASP Parameters for Medium-Resolution Data
- Section 3. Analyses of CNN Parameters for Medium-Resolution Data
LAMOST DR11 v2.0 was released to domestic users in September 2025. It consists of two components: low-resolution and medium-resolution data. In this document, we present statistical analyses of stellar parameters derived from both datasets. The parameters include those estimated by the LAMOST Stellar Parameter Pipeline (LASP) and an alternative set derived using a convolutional neural network (CNN).
In the following sections, we compare stellar parameters from LAMOST low- and medium-resolution spectra with those from SDSS DR19, APOGEE DR19, and GALAH DR4 to validate the reliability of LAMOST parameters. To provide a comprehensive overview of the LAMOST data, we have not applied any quality cuts to either LAMOST or the comparison survey data, presenting parameter comparisons for all common sources. It should be noted that null values and invalid values (such as -9999) have been filtered out from all parameters, and a very small number of outliers may exist beyond the displayed ranges in the figures. Furthermore, the distributions of parameter differences between LAMOST and other surveys may or may not follow normal distributions. Therefore, instead of using mean and standard deviation to characterize the difference distributions, we employ two more robust statistics applicable to both normal and non-normal distributions: the median of the differences ("median"), which measures systematic offsets between parameters from the two surveys, and the Normalized Median Absolute Deviation ("NMAD"), which quantifies the scatter. These two statistics are annotated on each difference distribution plot presented below.
Section 1. Analyses of LASP Parameters for Low-Resolution Data
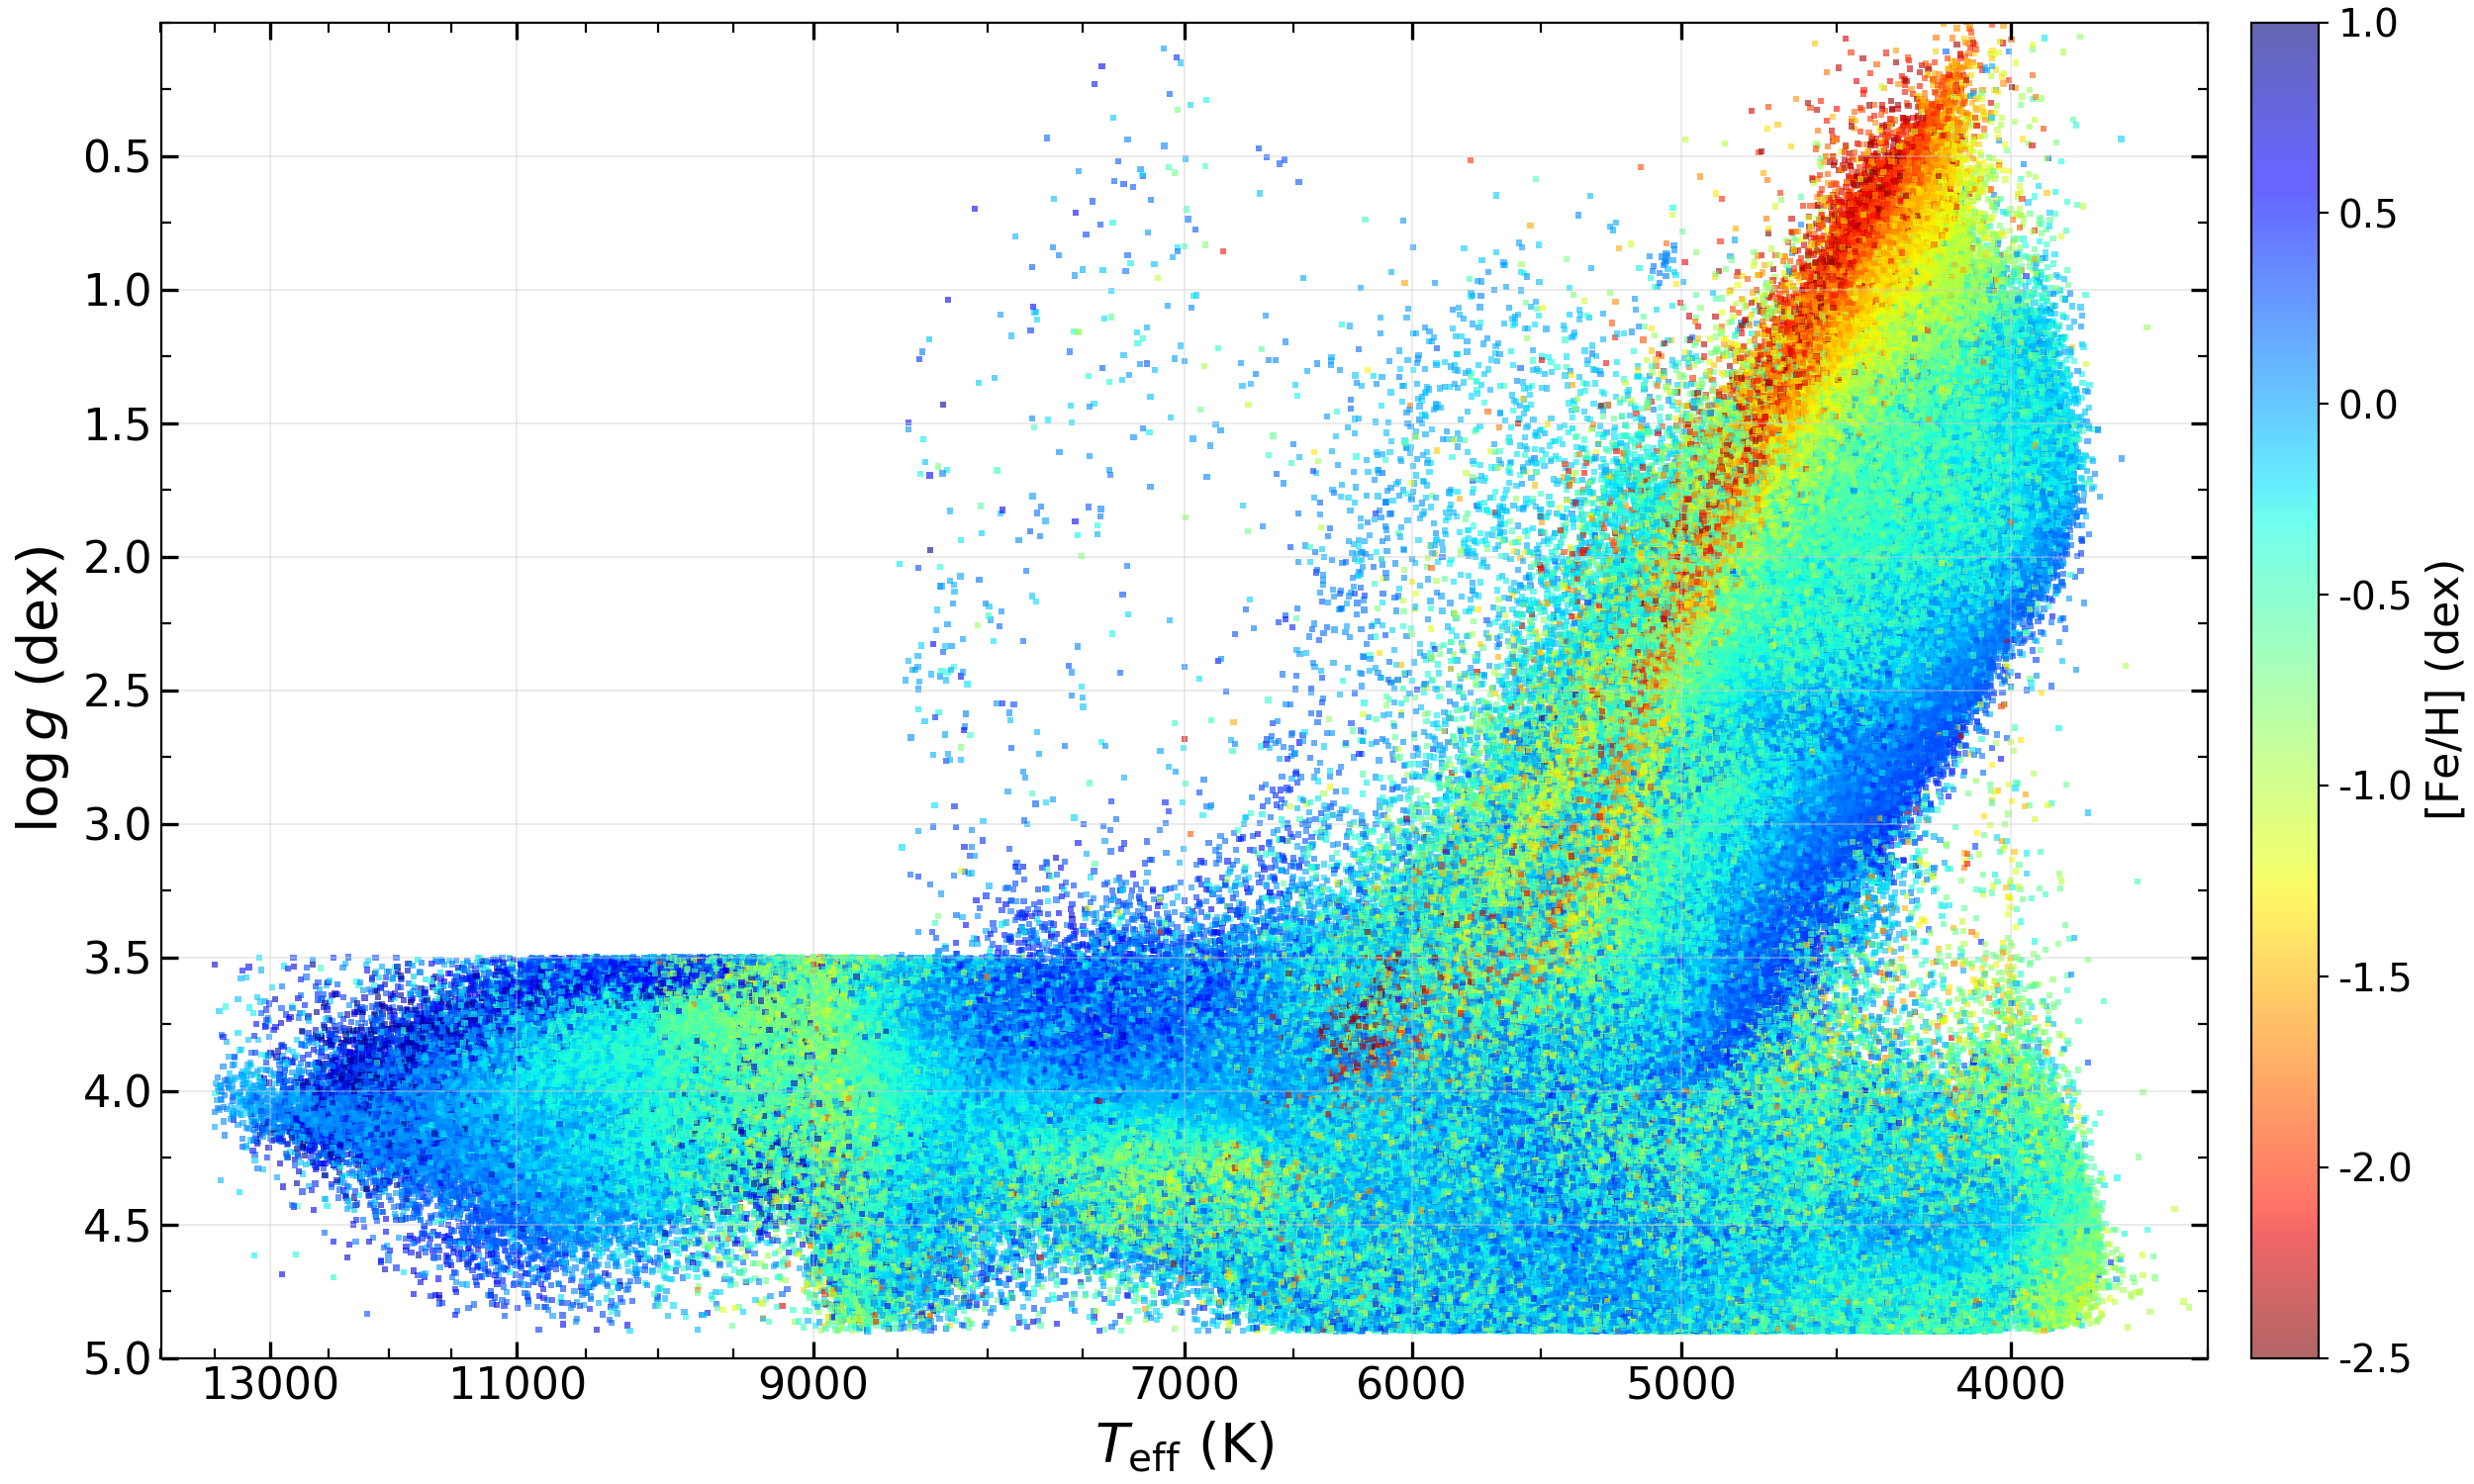
1.1 Kiel Diagram and Error Distributions
The Kiel diagram below shows the distribution of effective temperature (Teff) and surface gravity (log g) derived by LASP from LAMOST DR11 v2.0 low-resolution data, with data points color-coded according to metallicity [Fe/H] ranges.
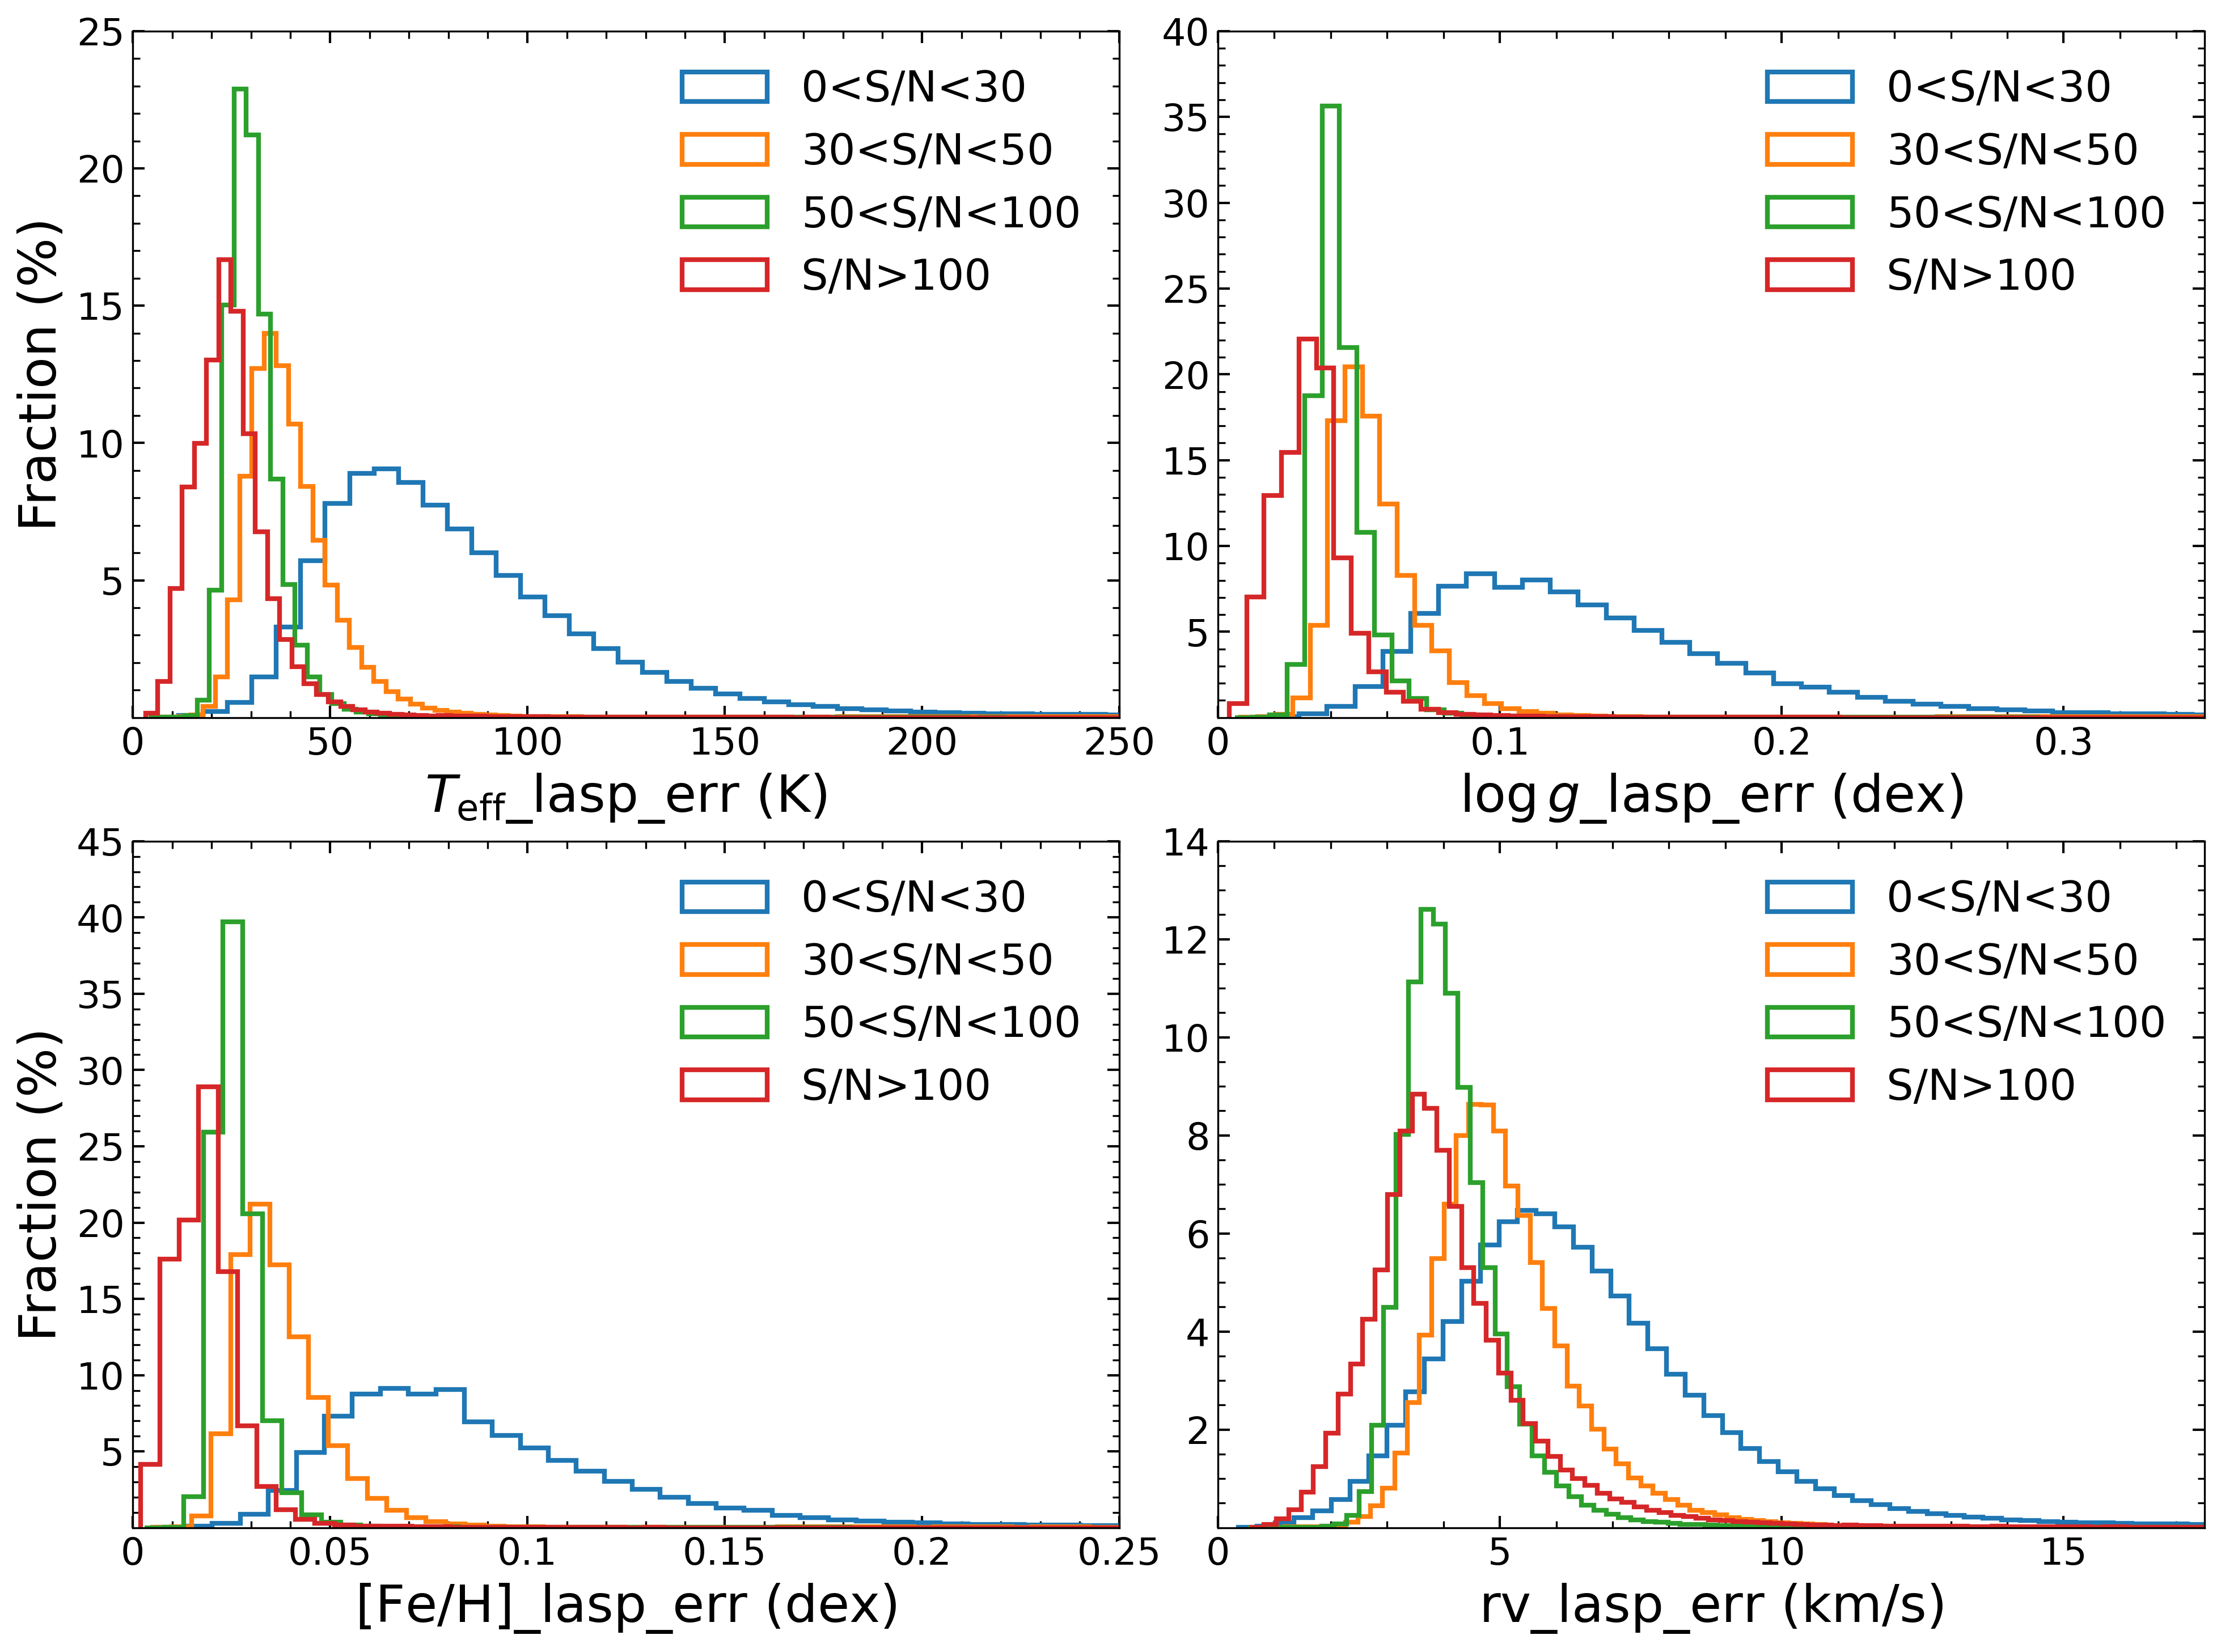
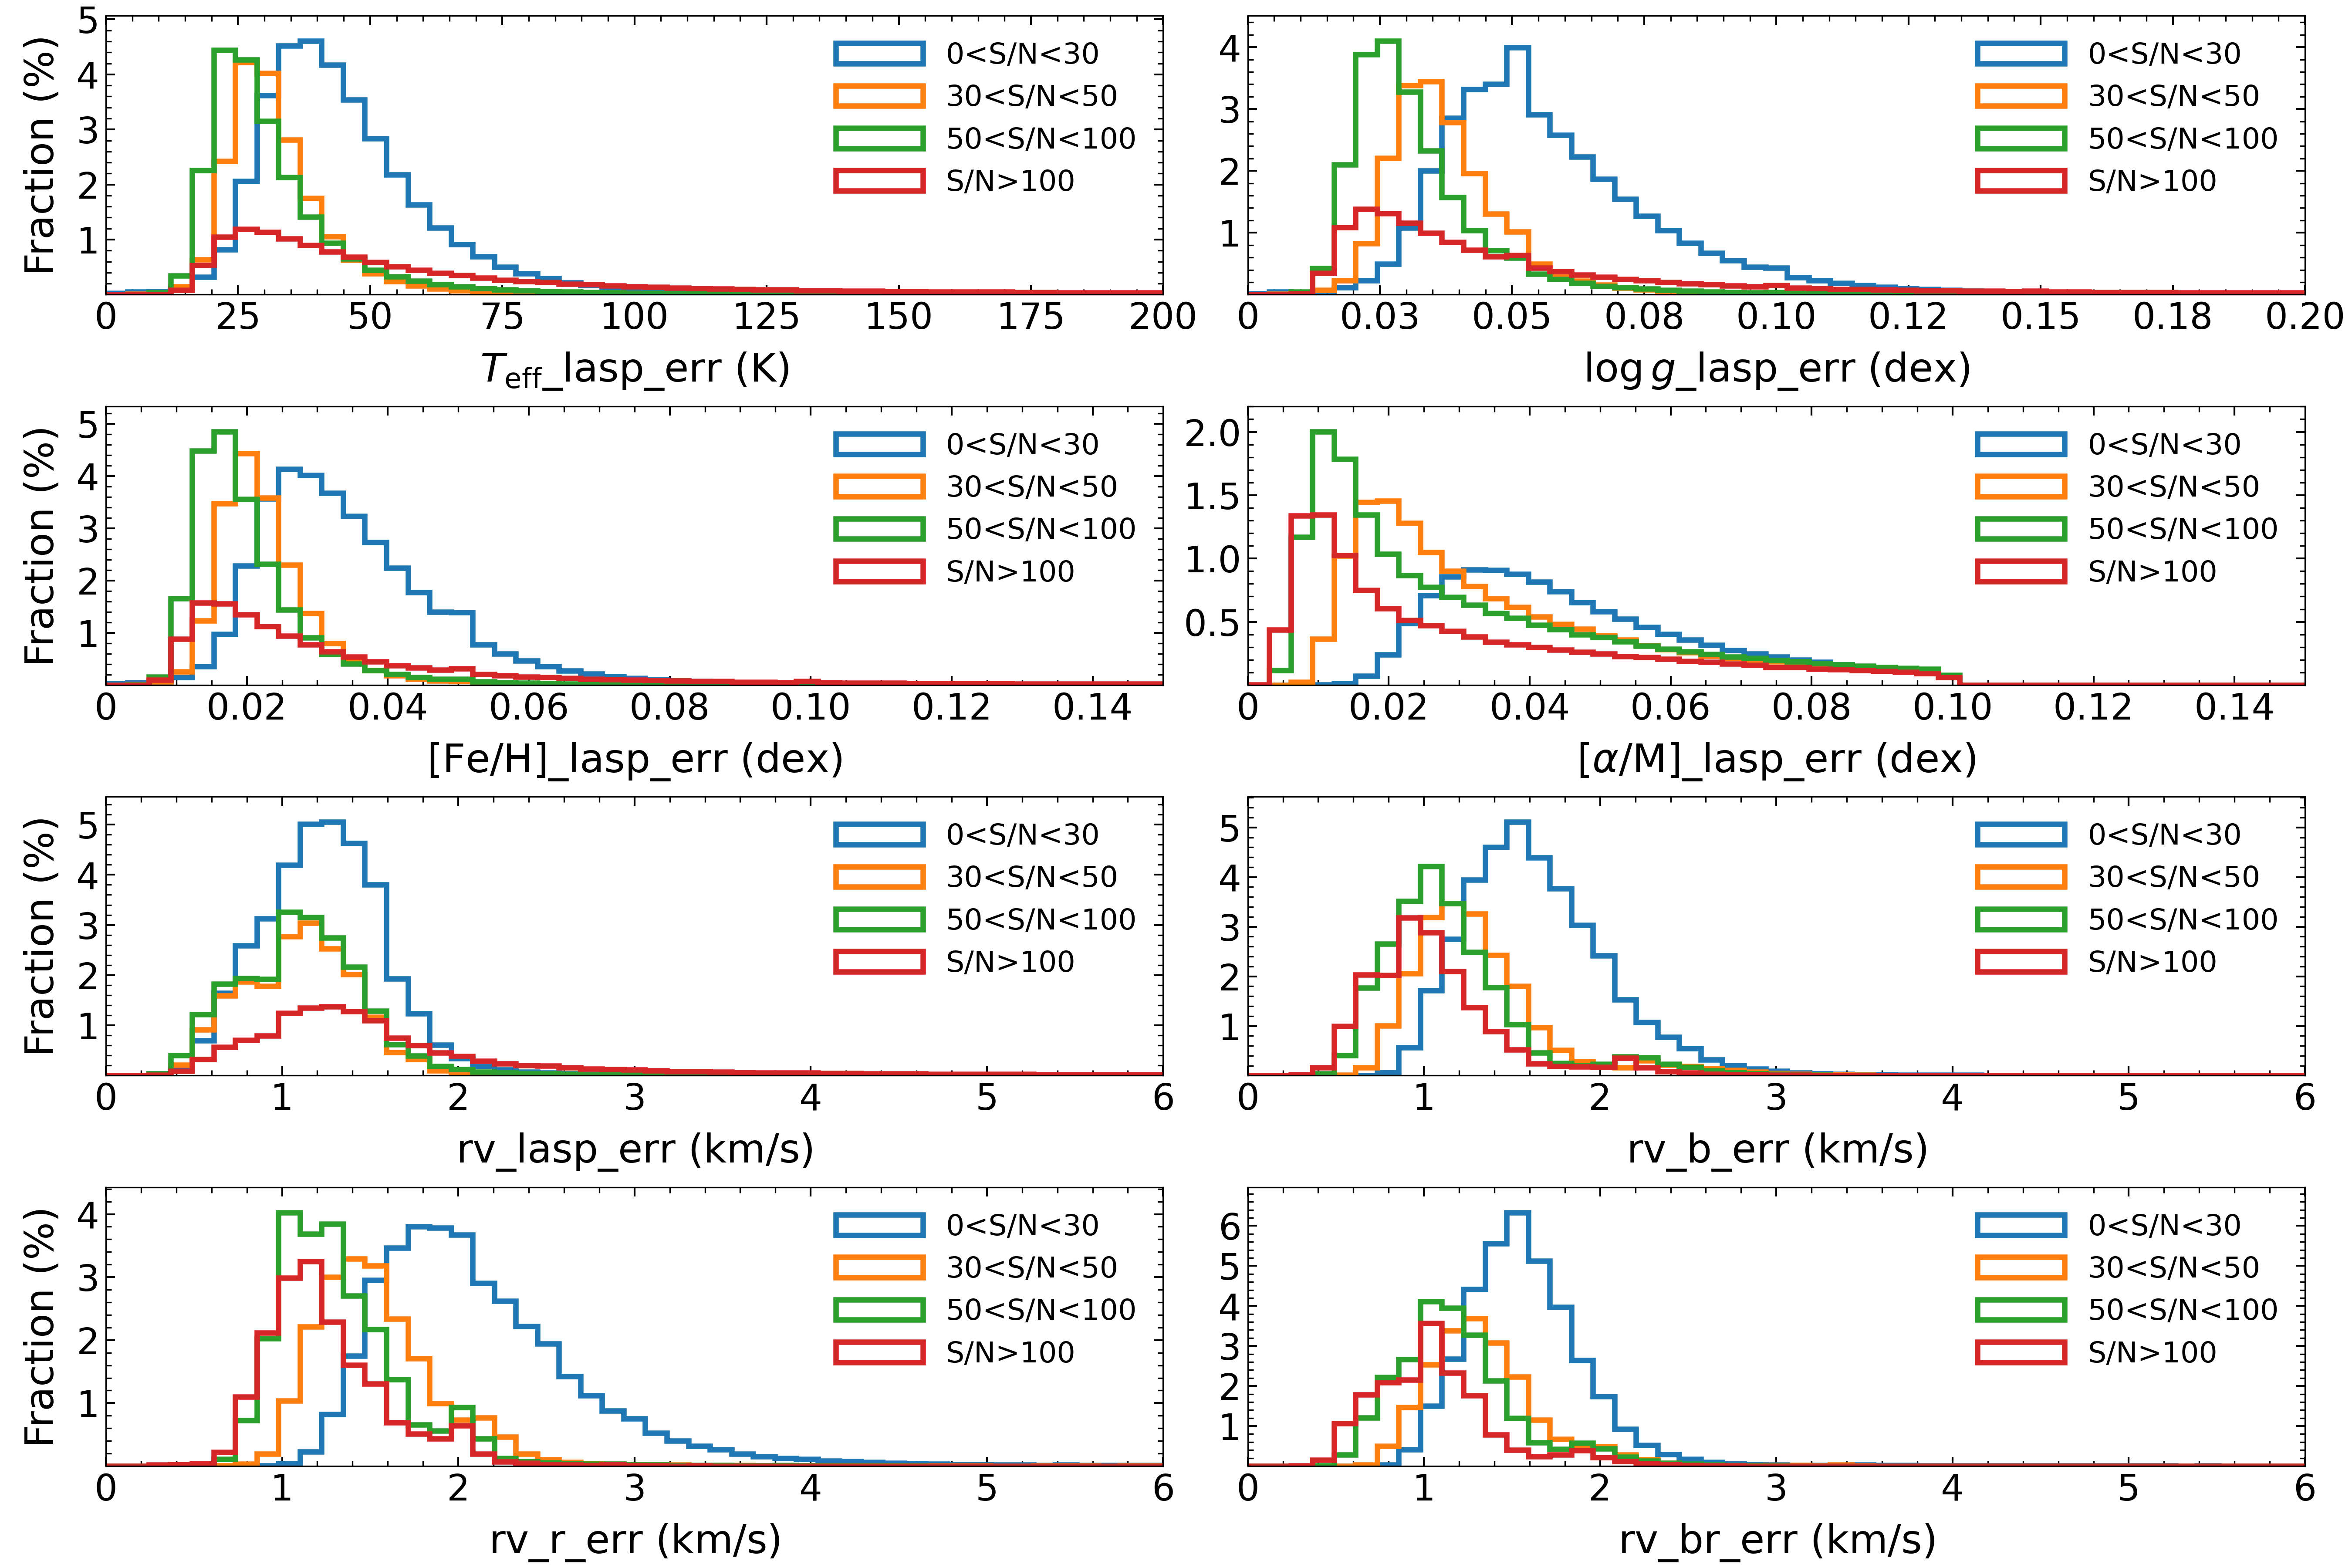
Distributions of LASP-reported uncertainties for effective temperature (Teff), surface gravity (log g), metallicity ([Fe/H]), and radial velocity (rv) in LAMOST DR11 v2.0 low-resolution spectra, grouped by r-band S/N bins. The y-axis of the figure below represents the percentage of spectra in each bin relative to the total number of spectra in each subplot. The y-axis meaning of subsequent histograms is the same as here.
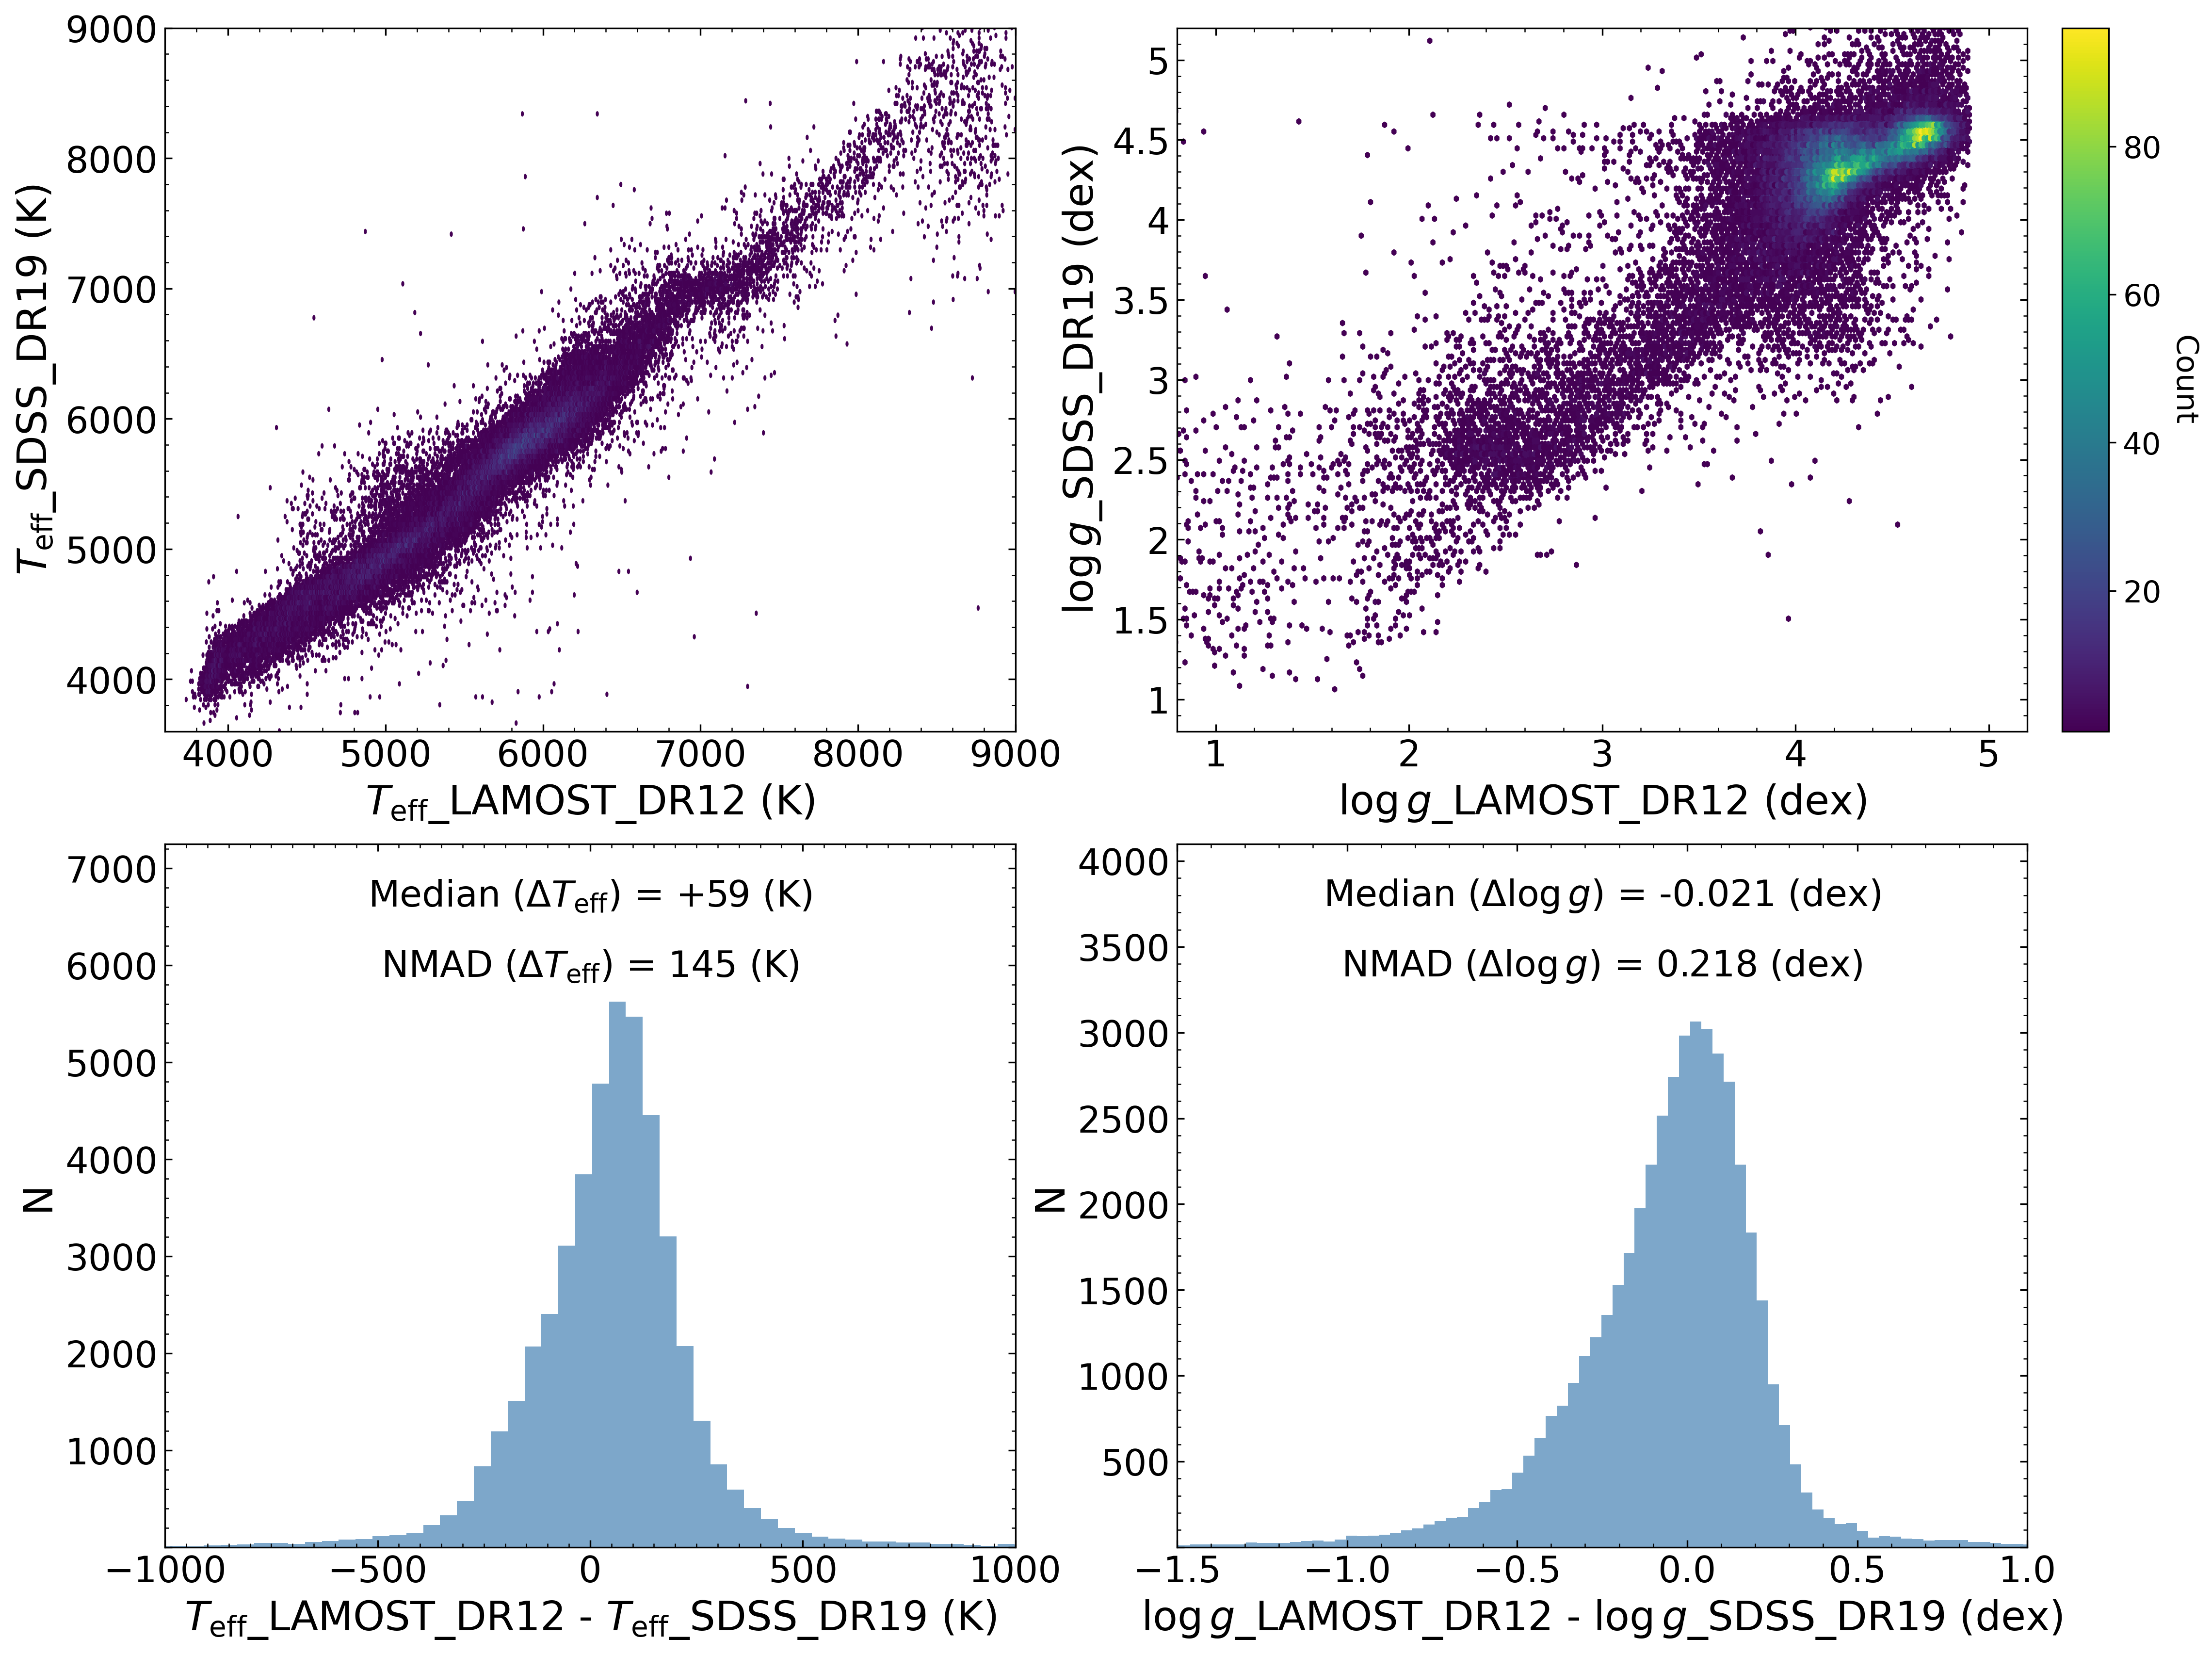
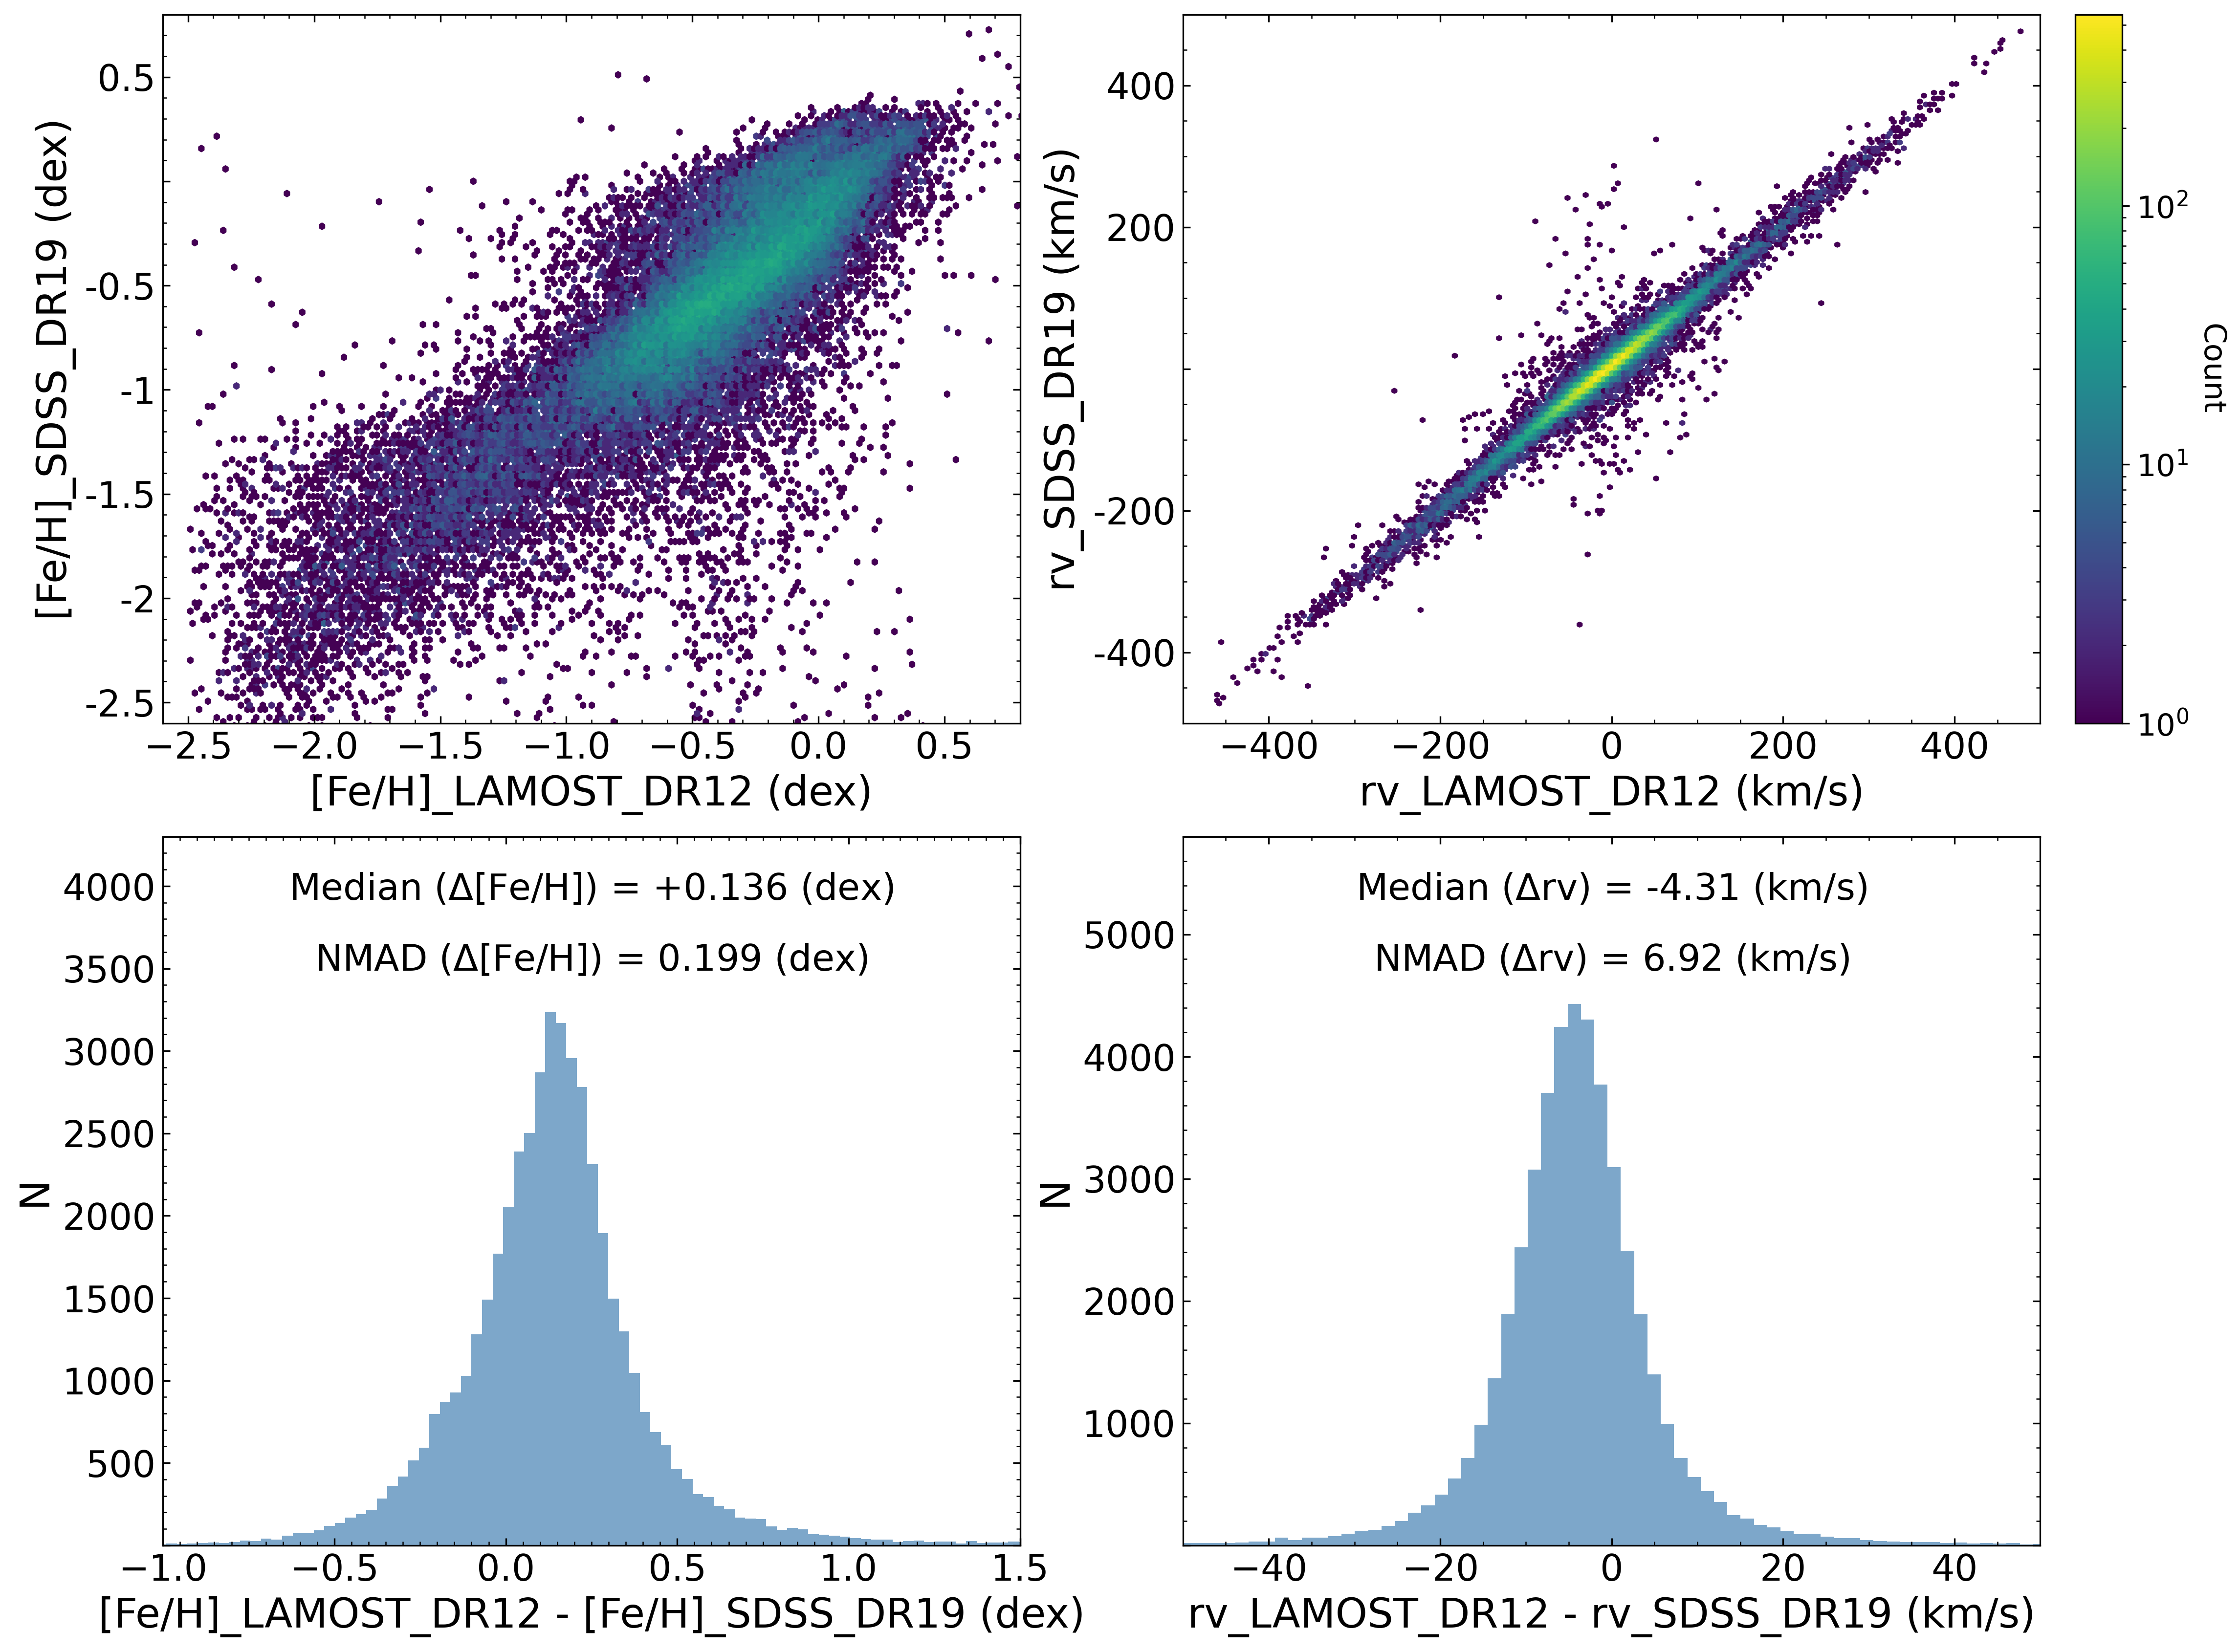
1.2 Comparisons with SDSS DR19
The figures below compare stellar parameters—Teff, log g, [Fe/H], and rv—derived by LASP from LAMOST DR11 v2.0 low-resolution spectra with those from SDSS DR19. For each parameter, we annotate summary statistics of the differences using the "median" and the "NMAD".
Section 2. Analyses of LASP Parameters for Medium-Resolution Data
2.1 Error Distributions
The panels show the distributions of LASP-reported uncertainties for Teff, log g, [Fe/H], α element abundance ([α/M]), and rv from the medium-resolution combined spectra, grouped by r-band S/N (colors as in the legend). Four rv solutions are included, each computed with a different method. For details on the radial-velocity calculations, please refer to the "Medium Resolution Data Description".
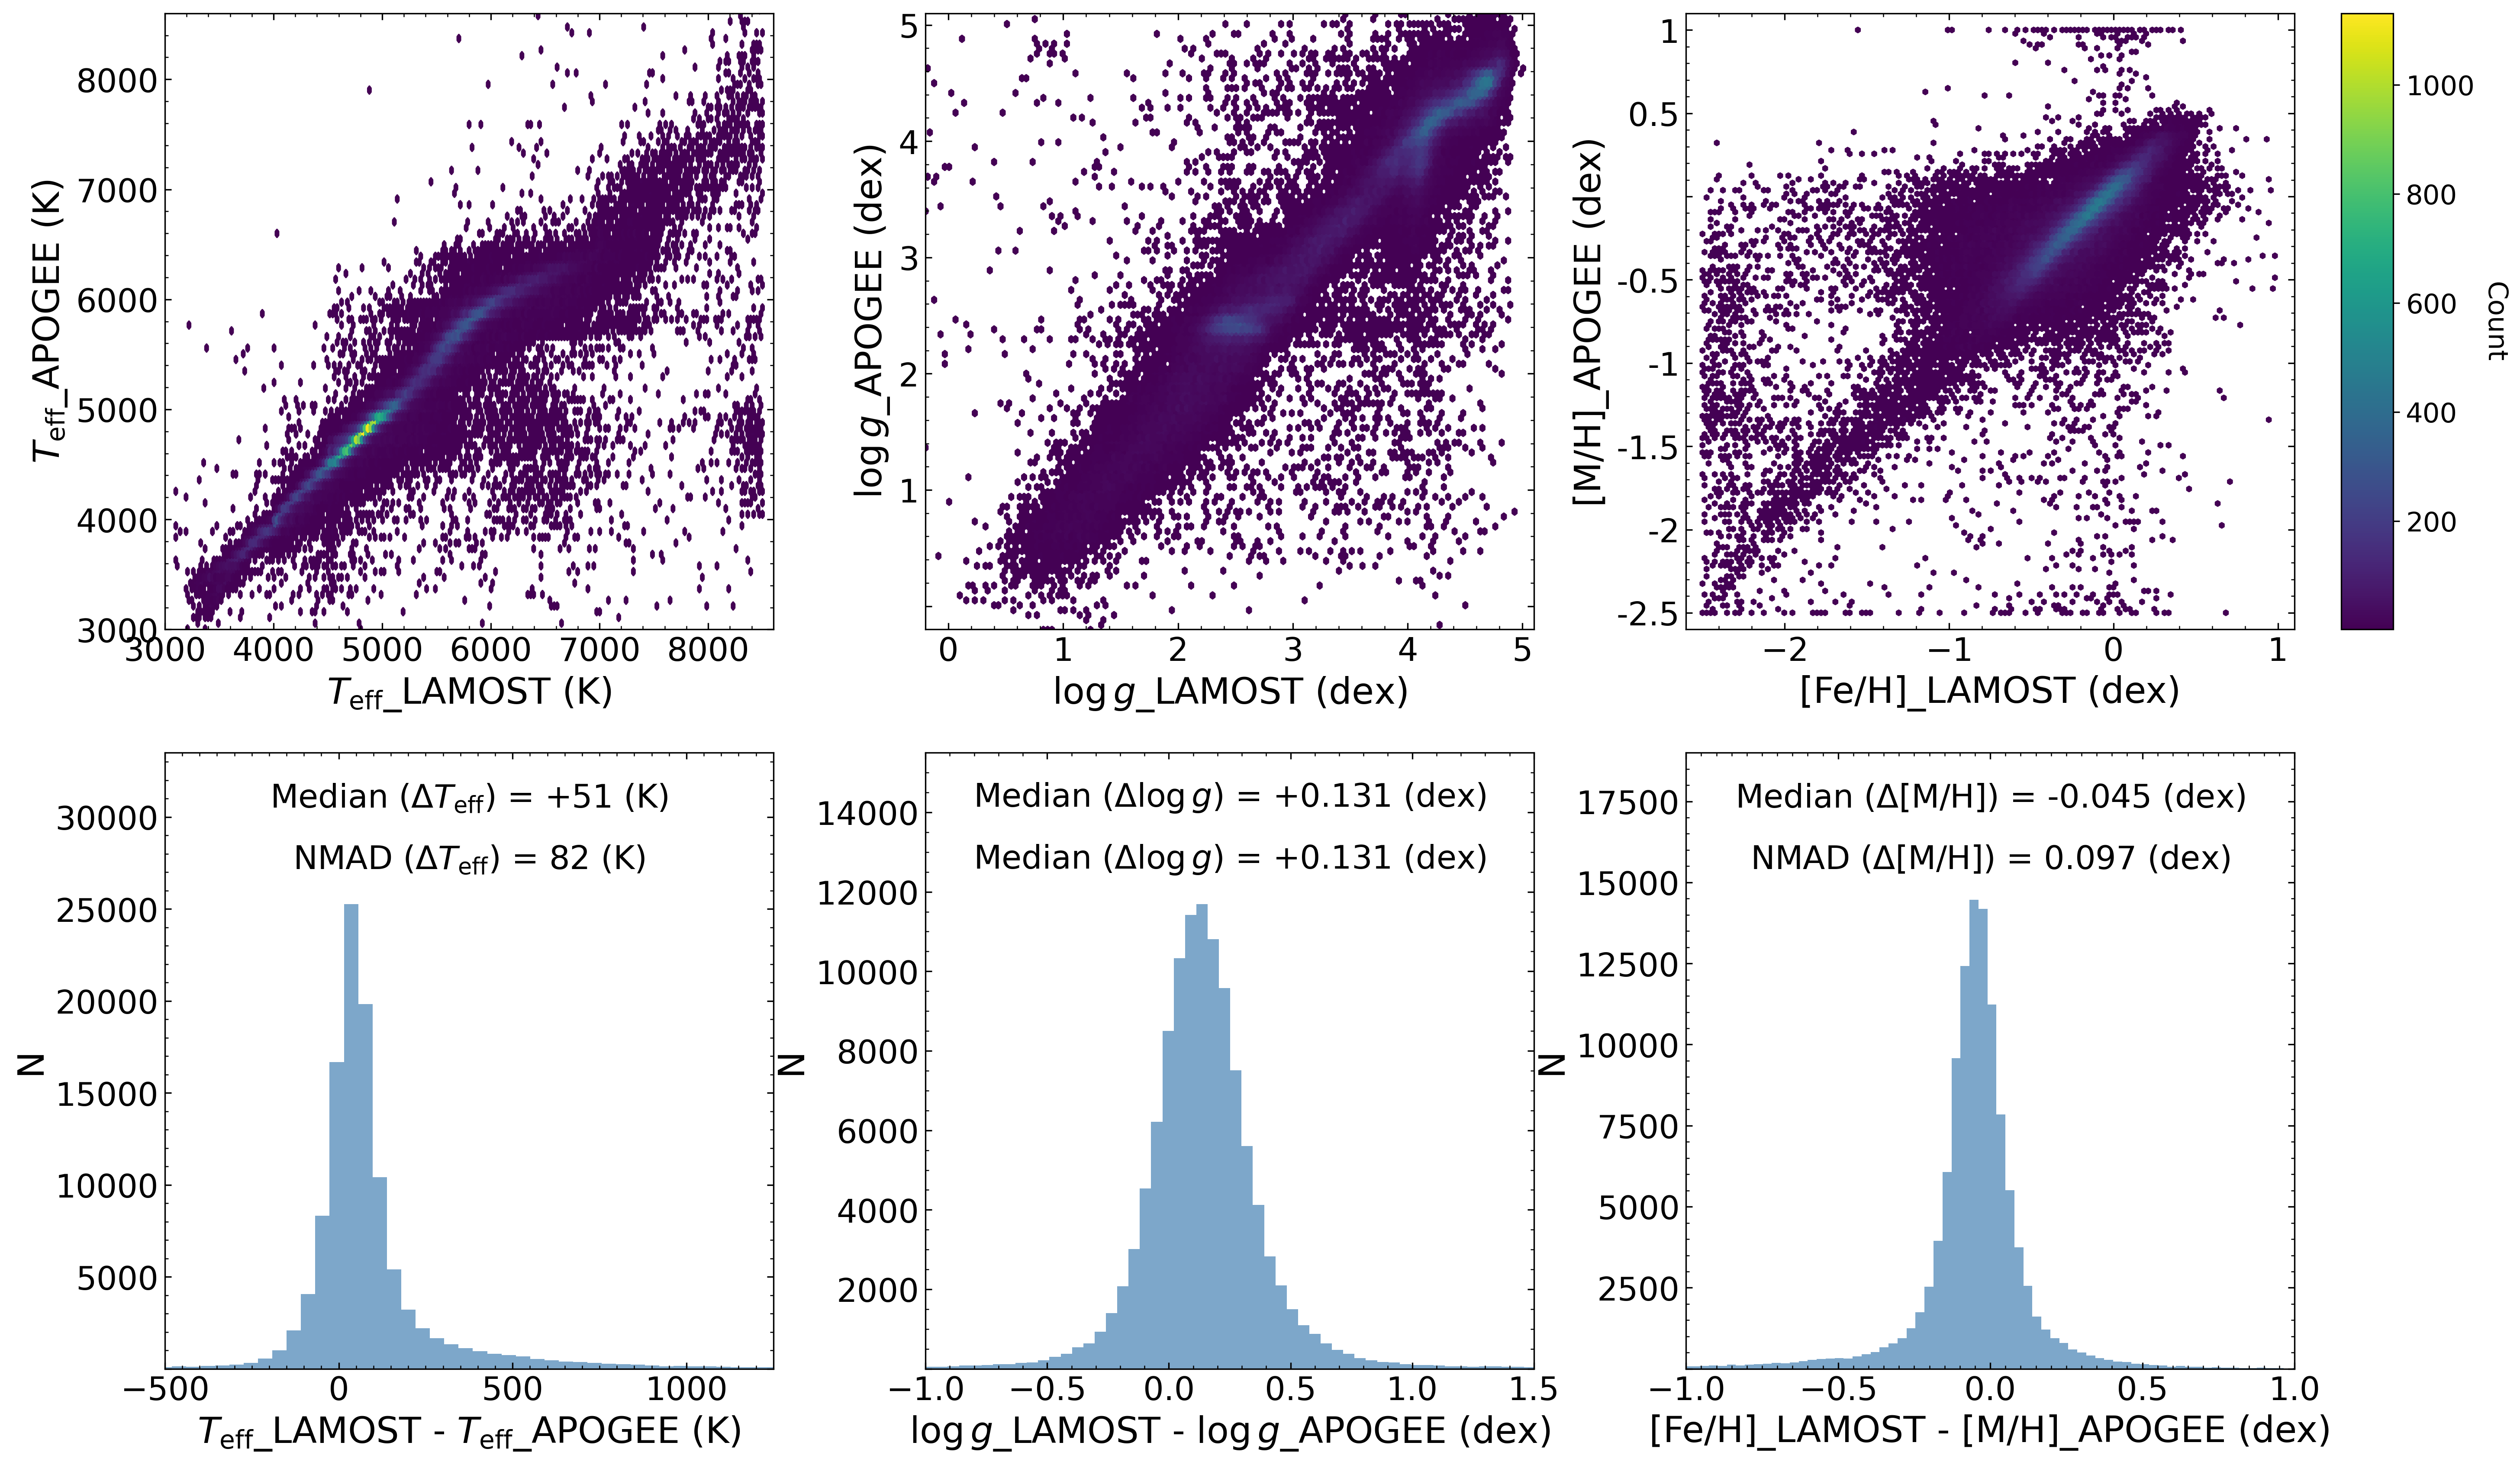
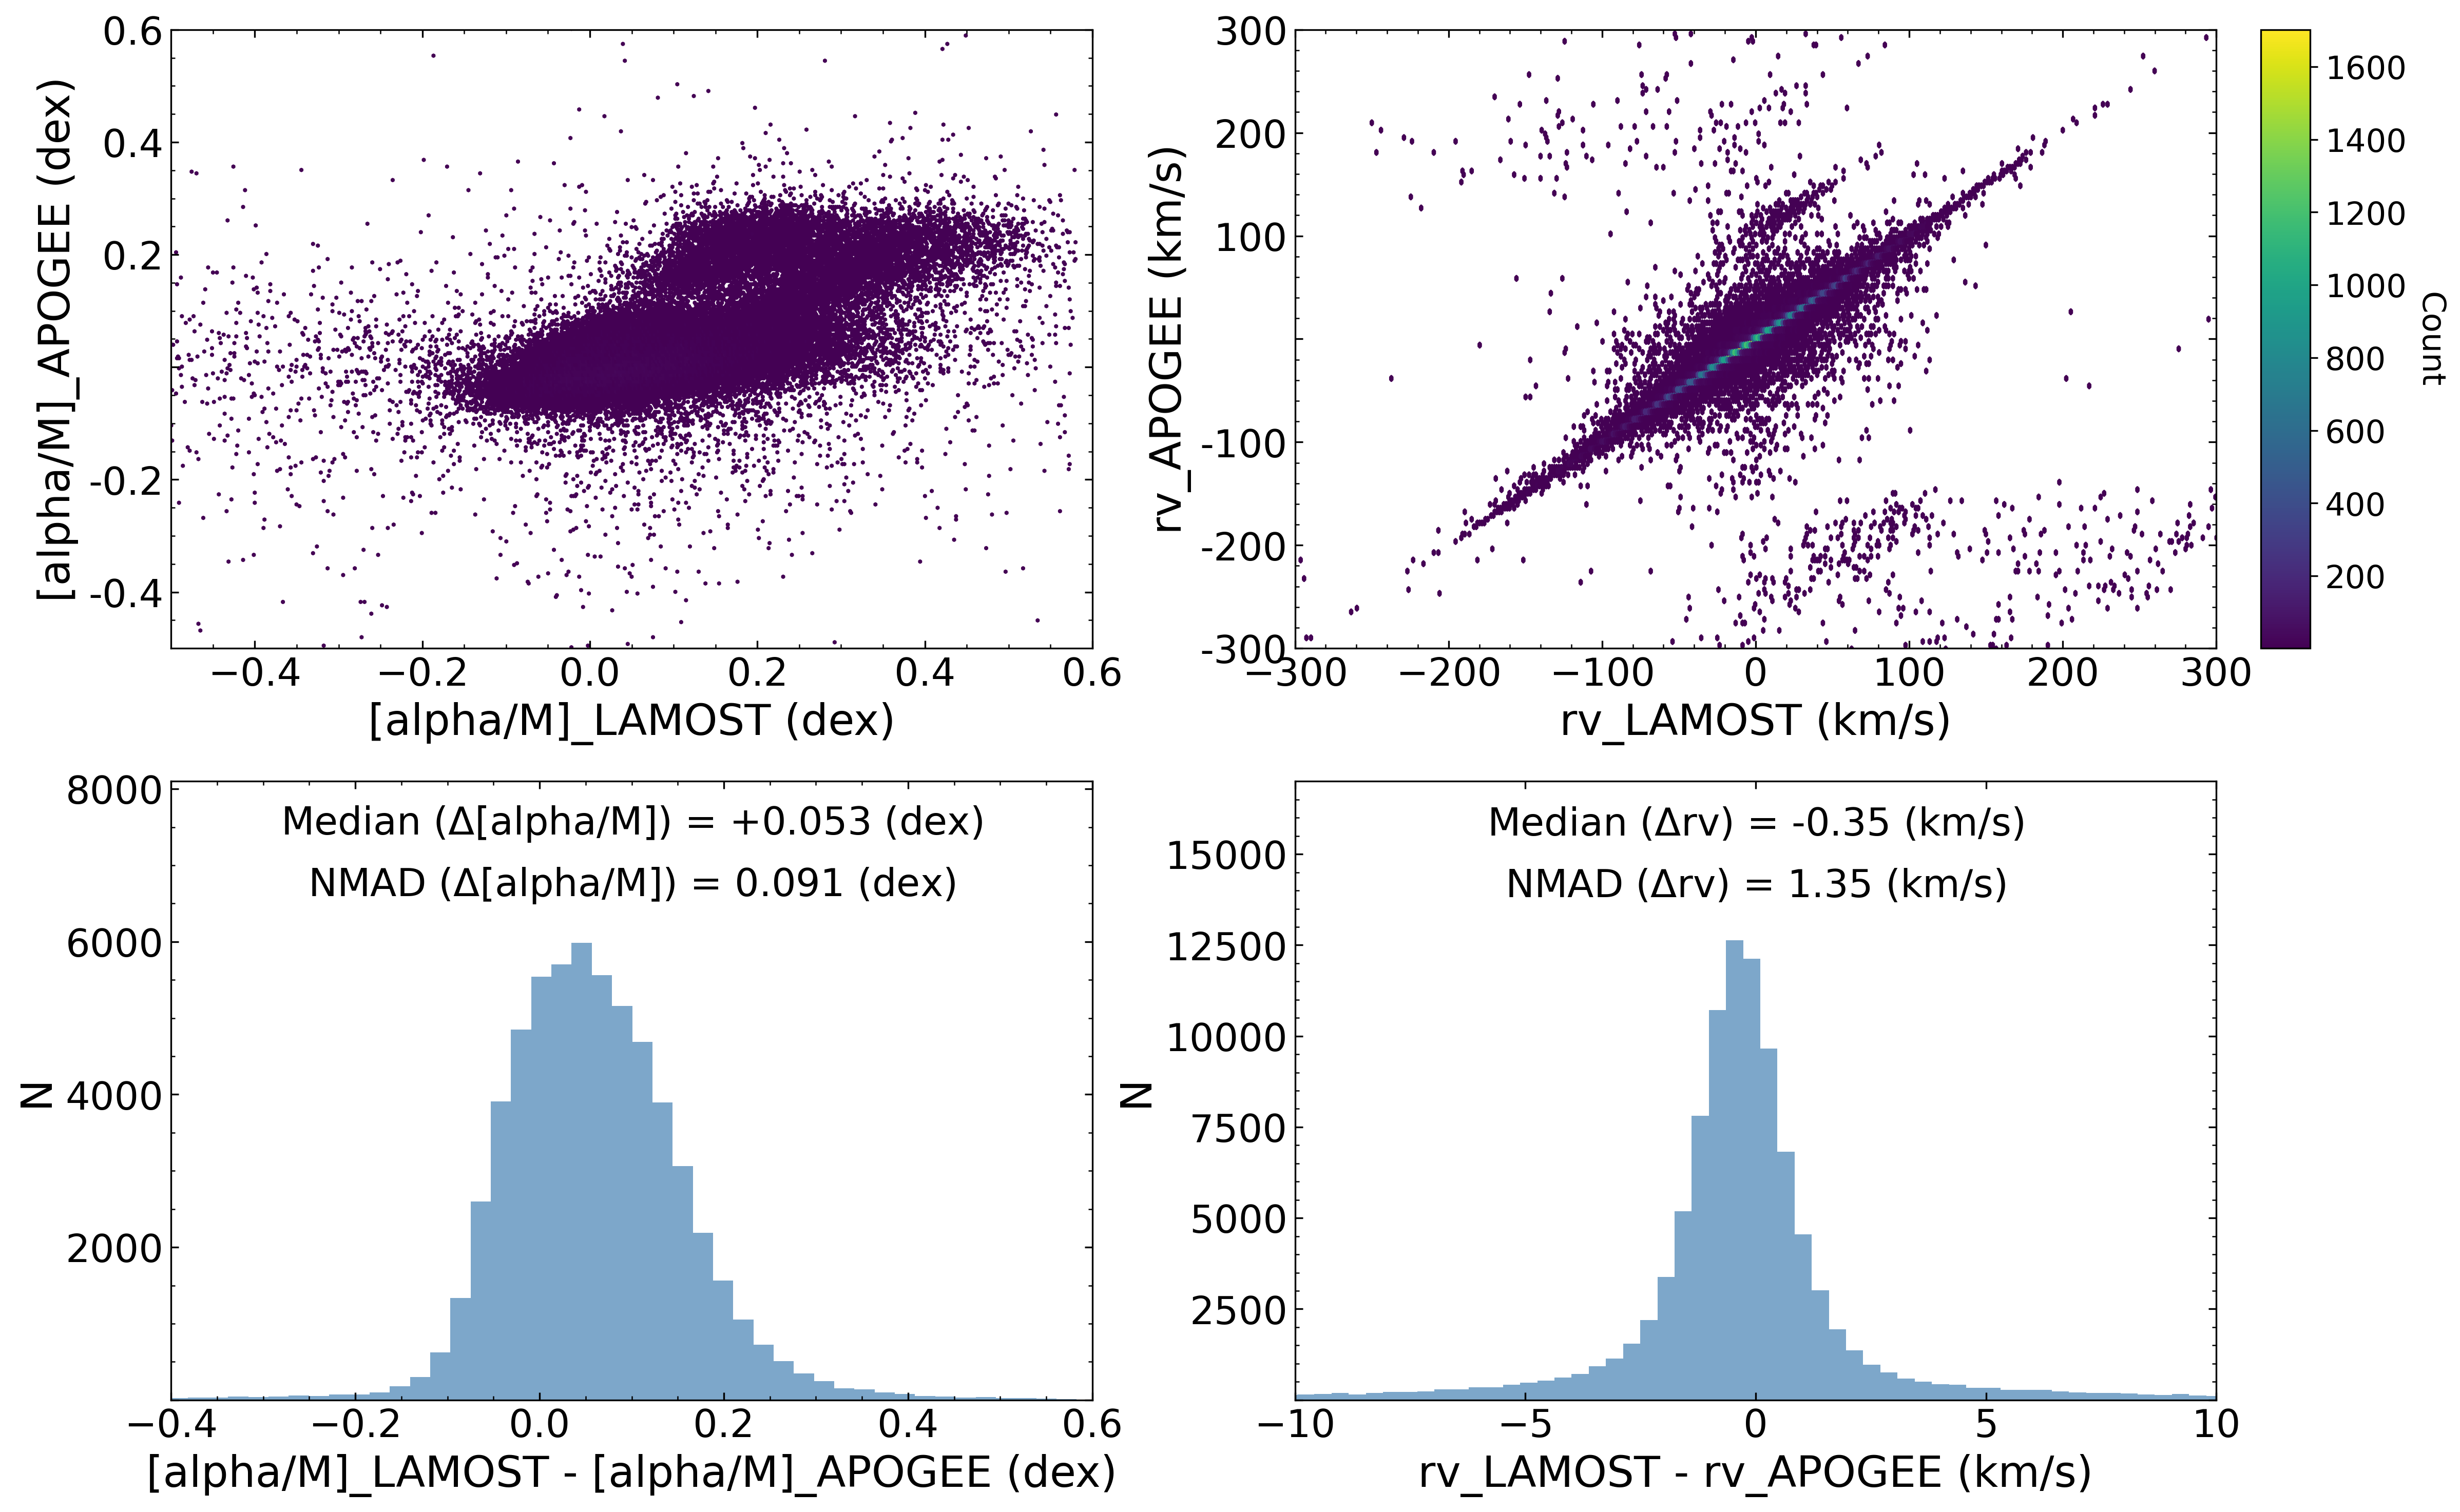
2.2 Comparisons with APOGEE DR19
Comparisons between LASP stellar parameters (Teff, log g, [Fe/H], [α/M], and rv) and APOGEE DR19 results are shown in the figures below. For each parameter, the panel reports the "median" of the LAMOST–APOGEE differences and the "NMAD" as a robust scatter estimate.
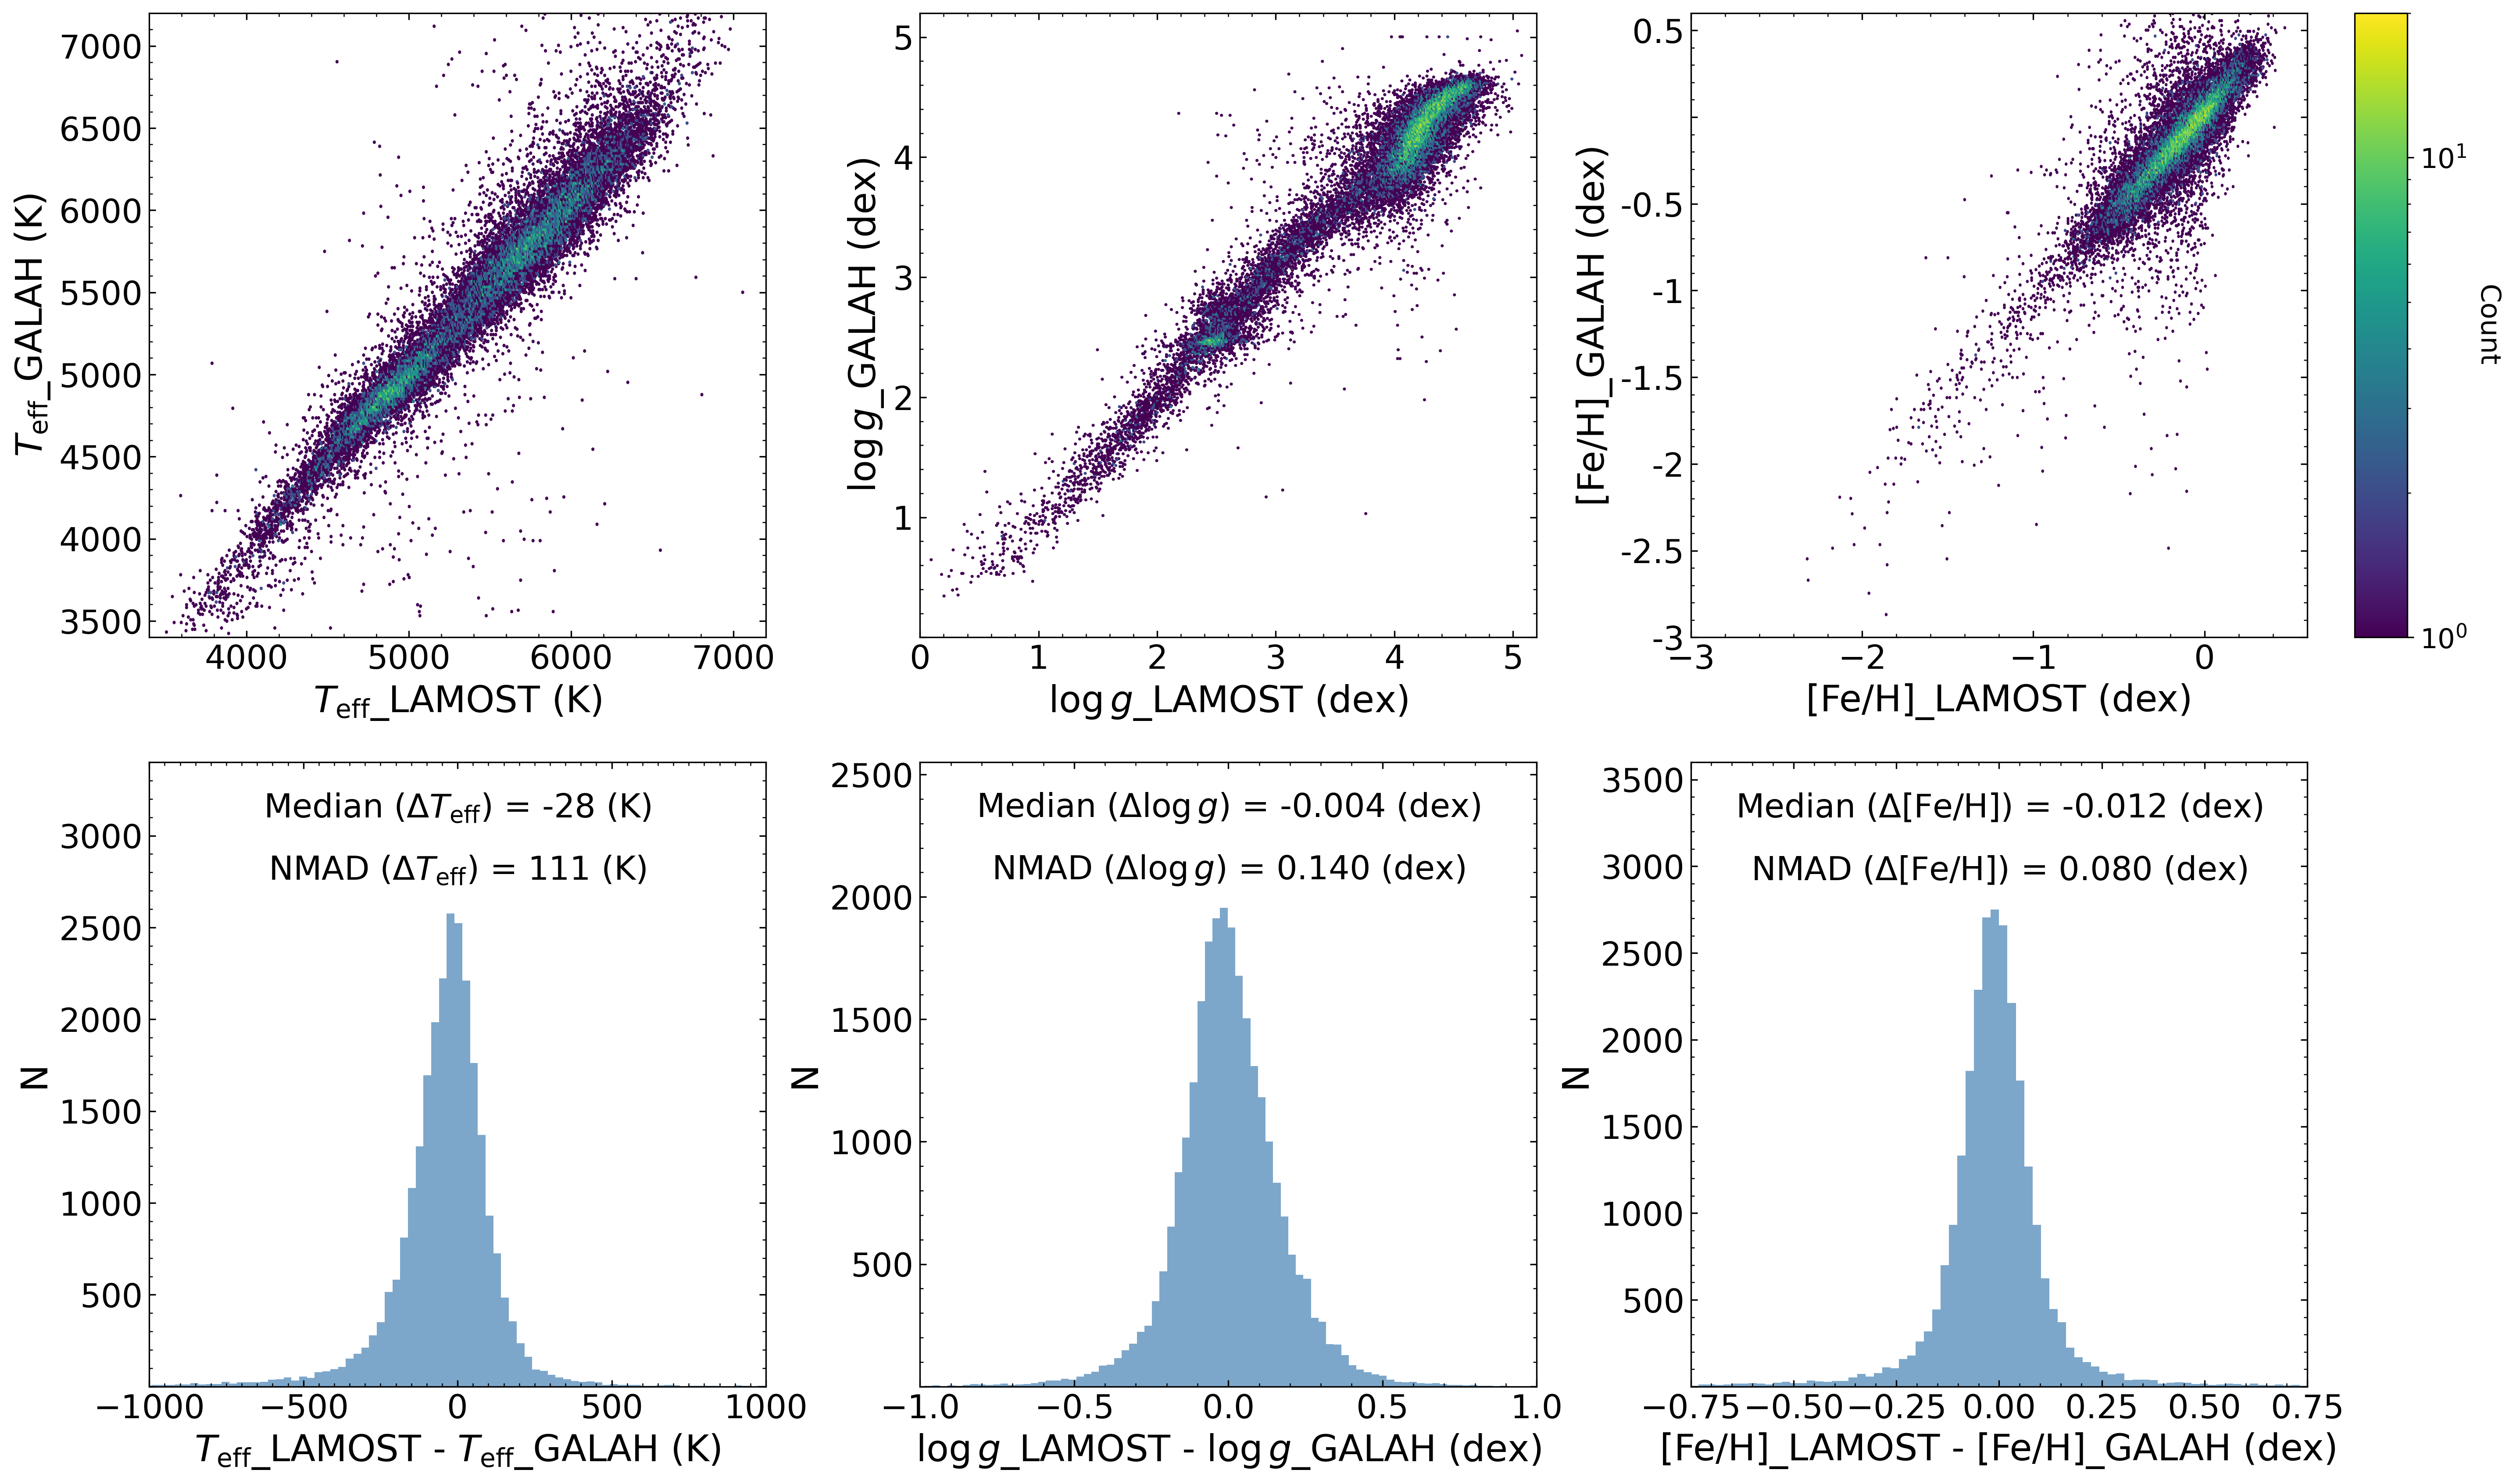
2.3 Comparisons with GALAH DR4
Comparisons of atmospheric parameters (Teff, log g, [Fe/H]) derived by LASP and GALAH DR4 are shown in the following figures. The statistical measures and their corresponding values are indicated in each parameter difference distribution plot.
The GALAH DR4 parameter catalog does not provide overall metallicity [M/H] and alpha-element enhancement [α/Fe], but instead provides individual elemental abundances including iron abundance [Fe/H] among others. Therefore, we did not conduct cross-validation between the α-element abundances measured by LAMOST and those from GALAH. Additionally, we performed a comparative analysis between the metallicity measured by LAMOST (denoted as [Fe/H] in the catalog) and the iron abundance [Fe/H] determined by GALAH. Although these two parameters are not strictly equivalent in the rigorous sense, this comparison is scientifically justified and effectively reflects the consistency between LAMOST and GALAH measurements results. This is because iron abundance serves as the standard proxy parameter for metallicity, exhibiting high correlation with overall metallicity, while their differences are typically small and generally fall below the level of observational measurement uncertainties. In the subsequent sections involving comparisons with the GALAH DR4 catalog, the metallicity comparison methodology and alpha-element abundance treatment remain consistent with those described herein.

Section 3. Analyses of CNN Parameters for Medium-Resolution Data
3.1 Kiel Diagram
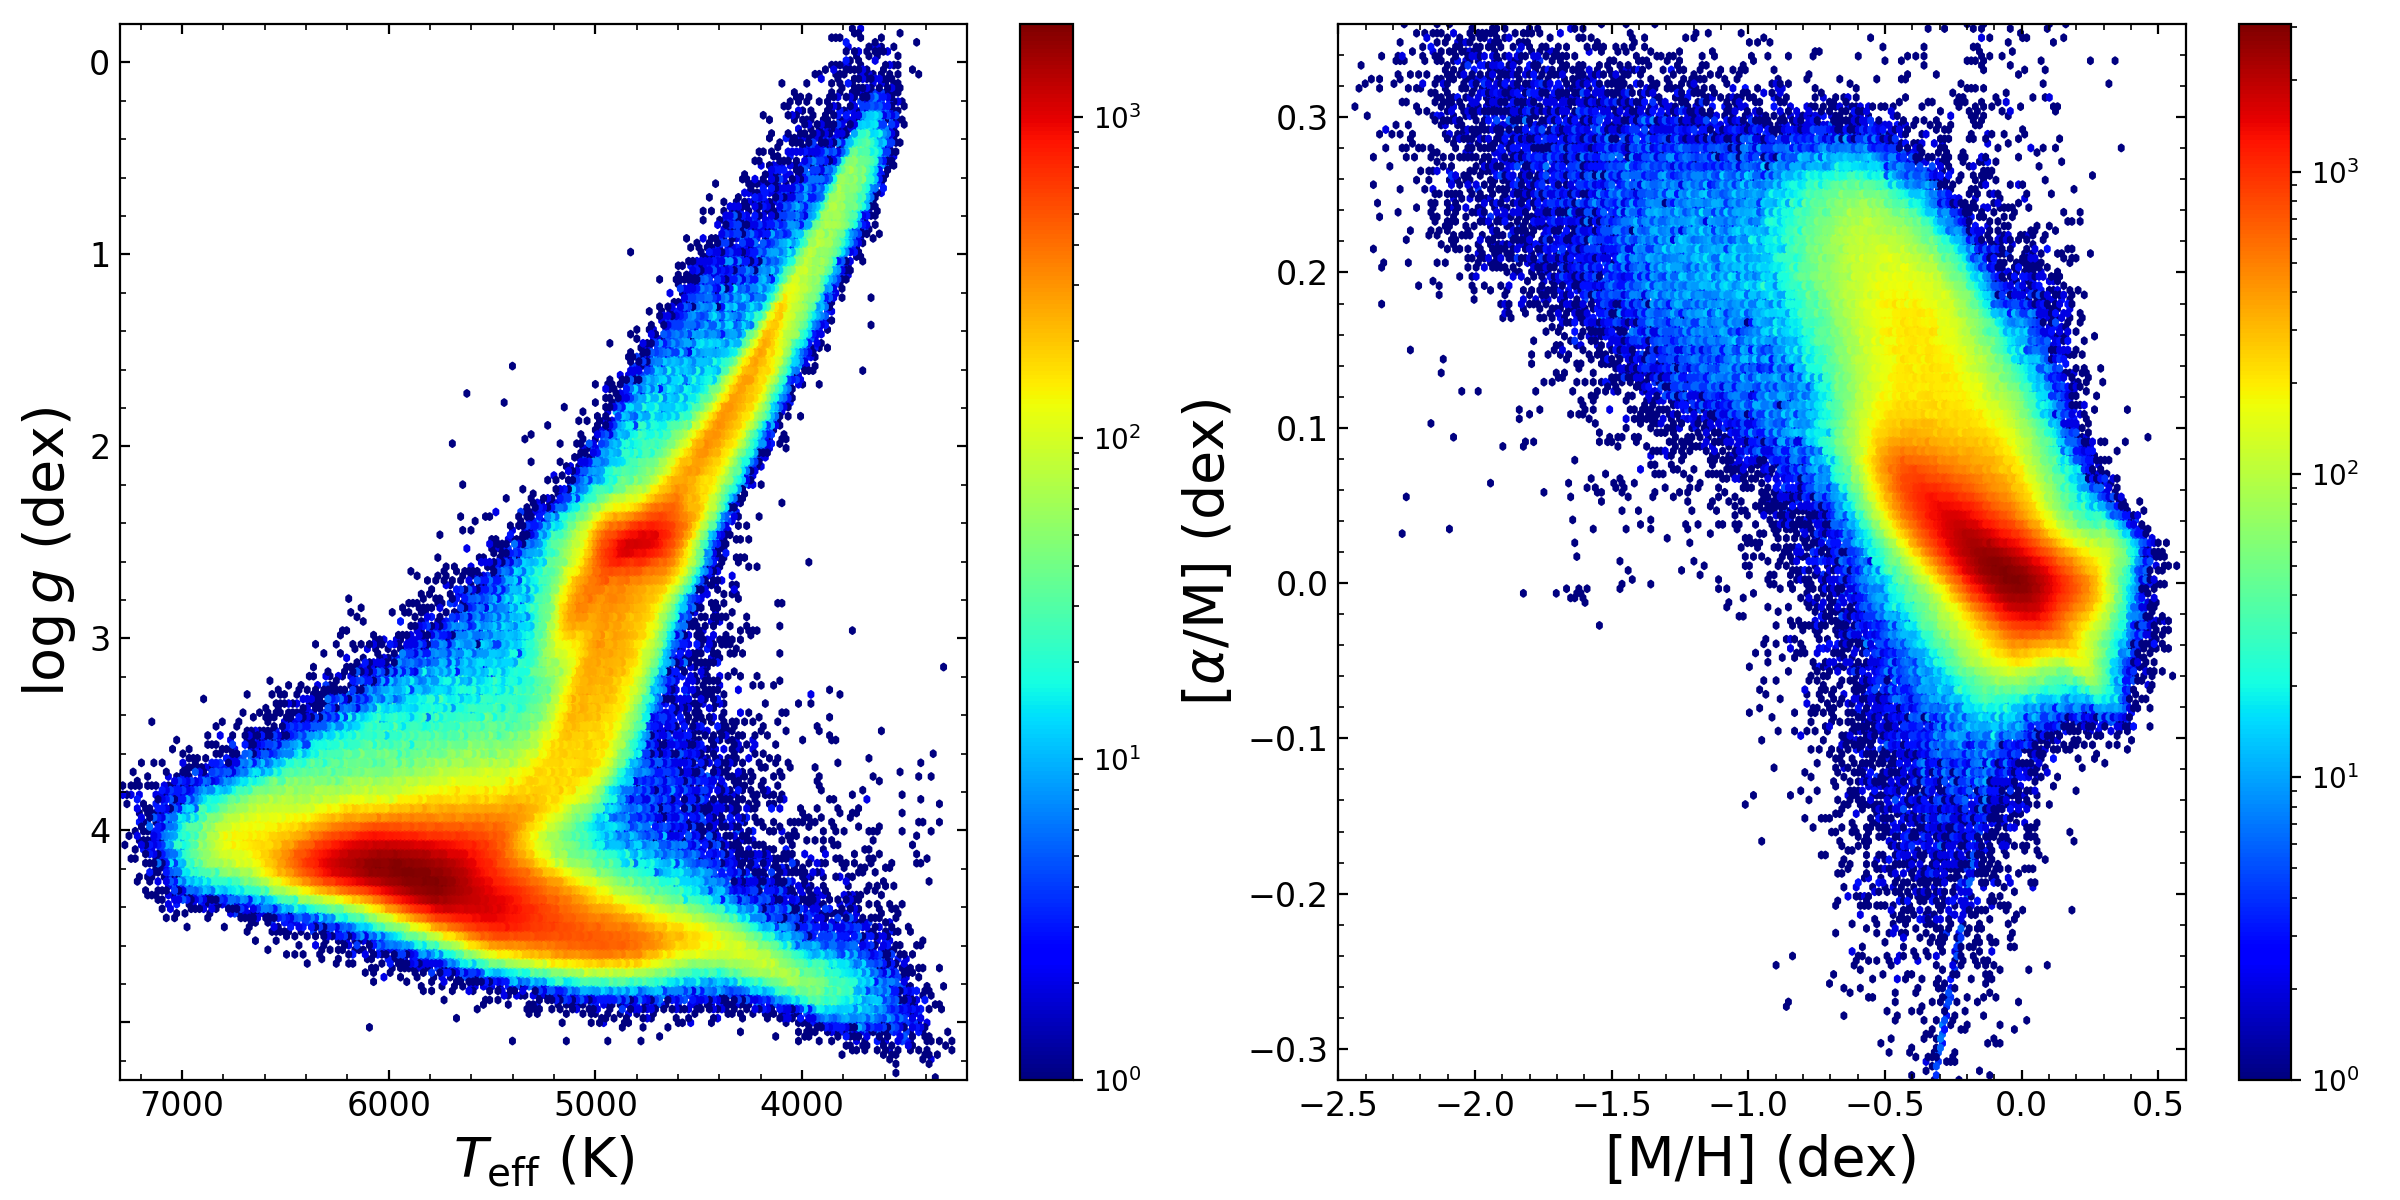
We also provide an additional set of stellar parameters, including Teff, log g, [M/H], and [α/M], derived using a convolutional neural network (CNN) approach. The corresponding Teff–log g diagram and [M/H]–[α/M] diagram for the combined spectra of DR11 v2.0 are presented below.
Additionally, we do not present error distribution plots for the parameters derived using the CNN method here, as the current implementation of this approach does not yet provide uncertainty estimates. Once error estimates become available in future, we will include the corresponding error analysis in subsequent data releases.
3.2 Comparisons with GALAH DR4
Comparisons between CNN-derived stellar parameters (Teff, log g, and [Fe/H]) and GALAH DR4 results are shown in the figures below. For each parameter, the panel reports the "median" of the LAMOST–GALAH differences and the "NMAD" as a robust scatter estimate.